Here is why you should treat this Dollar rebound with suspicion:
The Federal Reserve’s decision to flood the world with freshly “printed” Dollars in response to the pandemic may have triggered the end of a sideways consolidation for the DXY from early 2017.
The announcement by Fed Chairman Jerome Powell at the recent Jackson Hole Symposium of a new tolerance of inflation above the traditional 2 per cent target has made it clear the Fed will keep its key policy rate at zero for a very long time. Further, it may also signal prolonged, aggressive monetary expansion in pursuit of sustained inflation, which would further suppress the Dollar.
If secular decline in the Dollar is ahead of us:
Investors may want to hold fewer US Dollars in their portfolios and that includes all Dollar denominated assets – cash, stocks and bonds.
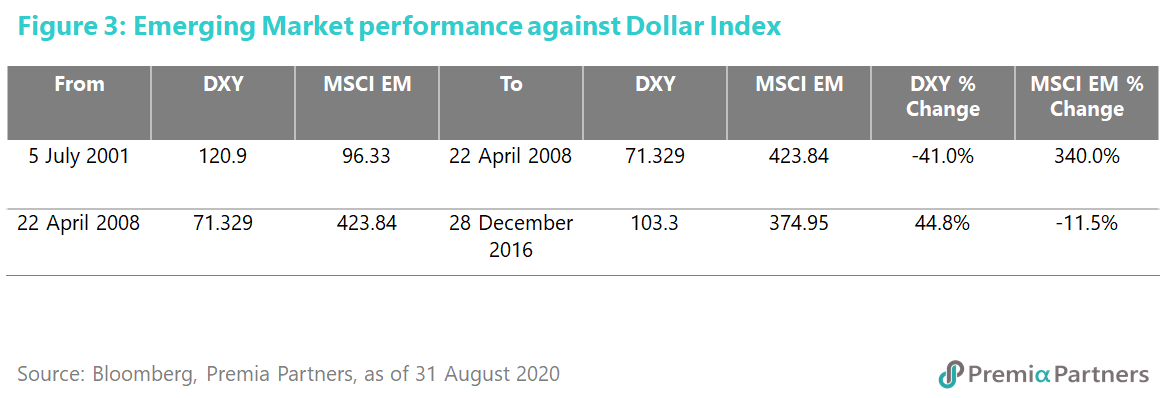
If history repeats, secular Dollar decline could boost Emerging Market economies and equities.
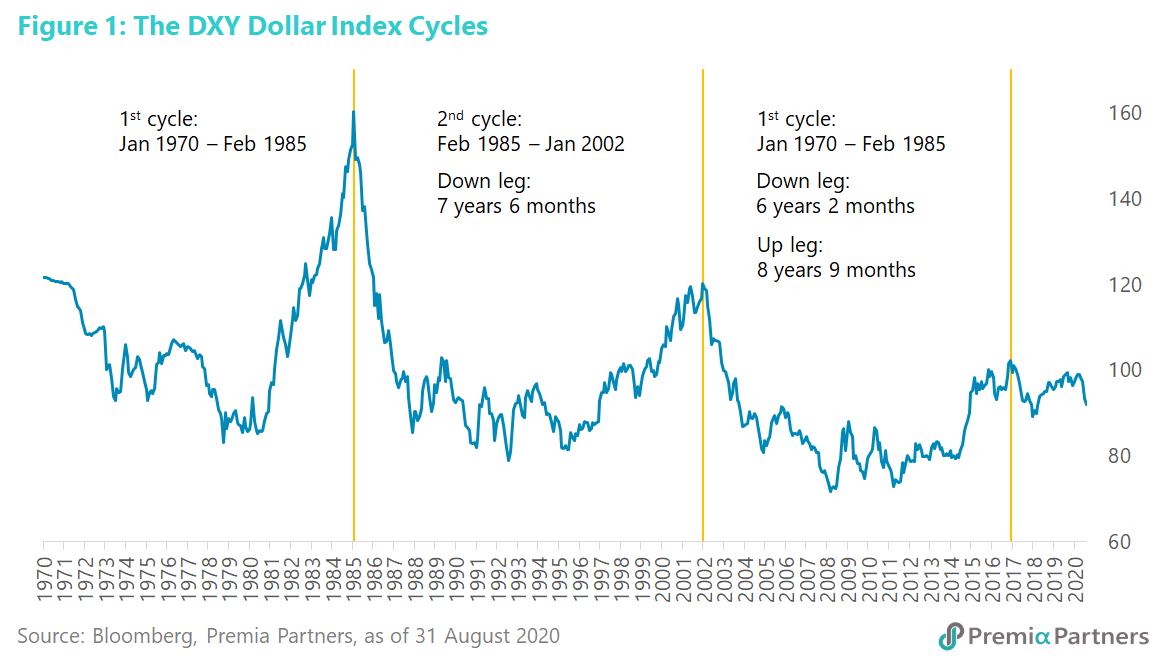
The Dollar’s 16-year cycles of lower lows. The US Dollar Index DXY has over the past half century run three full (up and down) cycles of approximately 16 years each, and each cycle has seen lower highs and lower lows.
We have referred to these cycles in previous Premia Partners Insights in the context of a similar, Federal Reserve Trade Weighted Dollar Index.
It is worth reconstructing, reviewing and updating this using the Bloomberg US Dollar Index DXY. The length of the up and down legs of the cycles vary a bit from one cycle to the next but the total length of a complete up-and-down cycle ranges from 15 to 17 years and averages 15.7 years (Figure 1). The down legs average 7.5 years and the up legs average 8.2 years.
We now appear to be in the early stages of another down leg, which started early 2017. If history repeats, this downward leg could last until anywhere between 2023 and 2025.
Aggressive monetary expansion, zero rates, and now, a new “average inflation targeting” policy. The United States has been the most aggressive in monetary expansion amongst the major developed market economies amidst the pandemic. The US expanded its M2 money supply 19% for the year to July, compared to around 7% for both the Euro Area and Japan, and 10% for the United Kingdom. This massive monetary expansion has turned the feared Dollar funding stress caused by the pandemic into a Dollar glut.
We have written about how Dollar weakness may be a deliberate policy objective, not a byproduct of stimulus.
At the recent Jackson Hole Symposium, Fed Chair Jerome Powell made clear the Fed had abandoned its traditional 2 per cent inflation target, to a new policy of tolerance of an overshoot of that target to ensure it entrenches inflation, under the euphemism of “average inflation targeting”. Mr. Powell said it would “seek to achieve inflation that averages 2 per cent over time.”
So, when inflation had been running below the 2 per cent “average”, the Fed would “aim to achieve inflation moderately above 2 per cent for some time.” In short, the Fed has every incentive to keep rates at zero for a long time and to keep pumping out as many US Dollars as necessary to entrench that desired inflation.
First interest rate hike in the US above the “zero bound” should be around 2024. On the basis of Jerome Powell’s new paradigm for Fed rate management, the earliest the Fed Funds Rate can pop its head above zero could be 2024, or even 2025.
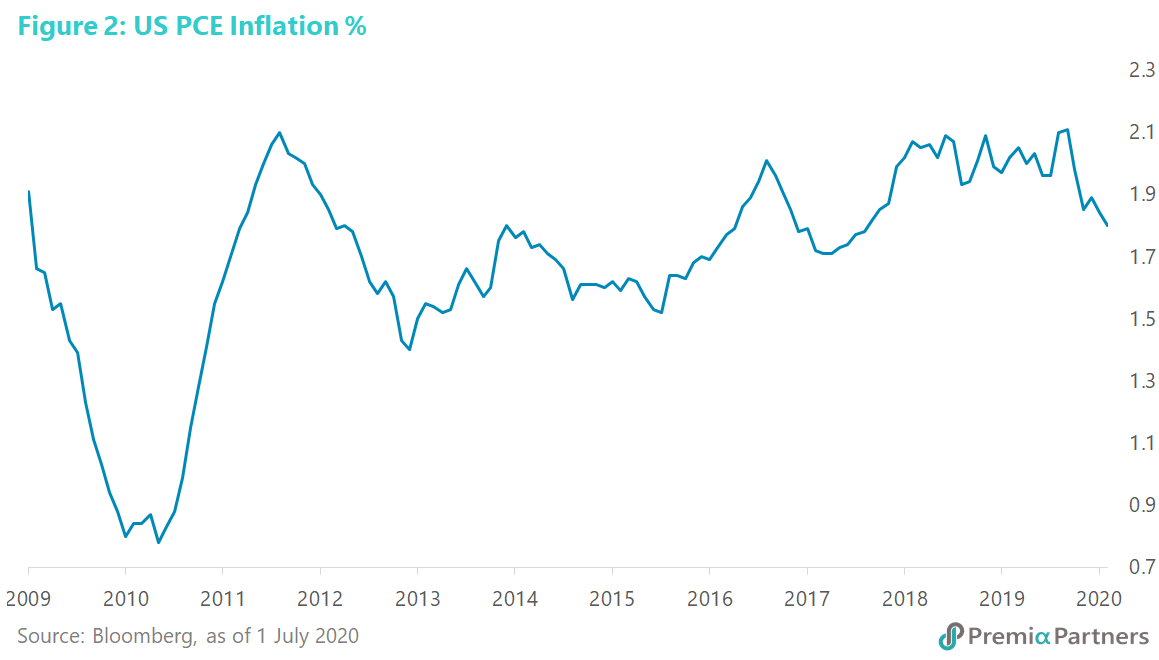
At the June FOMC meeting, the Fed’s forecast of PCE inflation was 1.55 per cent in 2021, and 1.7 per cent in 2022. Bear in mind the Fed has had a dismal track record for hitting the 2 per cent target since the Great Recession of 2008-2009. In the past 11-plus years, the US has only seen 22 out of 134 months with PCE inflation at or above 2 per cent (figure 2). 16 per cent is not a good track record.
Yet, even assuming a straight-line projection from the Fed’s own forecasts, it should be 2024 before it hits 2 per cent, and that coincides with the historical average down-leg of 7.5 years from the prior peak in December 2016.
Nevertheless, allowing for Mr. Powell’s new “average inflation targeting” paradigm – which should see the Fed allowing many months of overshooting 2 per cent before it raises interest rates – it could well be 2025 before the Fed pops its head above the interest rate “zero bound”.
Why a weak Dollar regime could boost Emerging Markets. In a weak Dollar environment, particularly when US asset yields are being suppressed by zero policy rates and quantitative easing, US Dollar investors would likely look for hedges against weakness in the Greenback. Capital outflows from the US could particularly benefit Emerging Markets given structurally higher economic growth potential and yields. Also, a weaker Greenback lightens the burden of US Dollar debts in Emerging Market economies.
In the last DXY cycle, Emerging Market performance was inversely related to the Dollar Index’s performance (figures 3). (Note the below table uses intra-month peaks for dating the cycles, rather than month-end closes used in figure 1.)
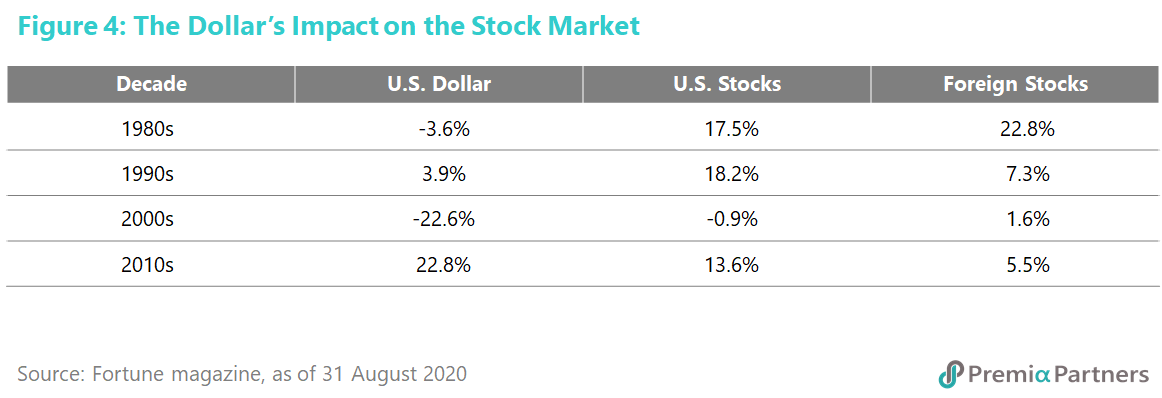
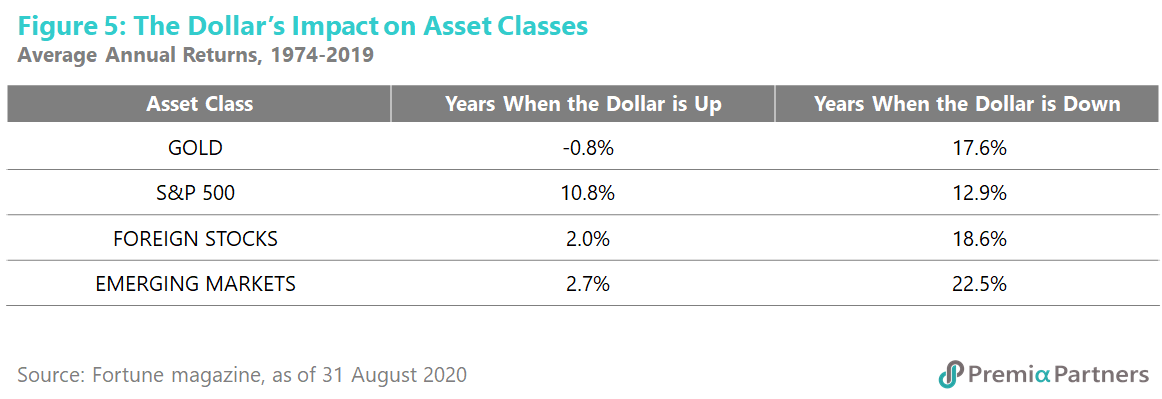
Fortune magazine has also pointed out that historically, weak Dollar years have driven foreign (non-US) stock and Emerging Market outperformance (figures 4, 5).
The argument against broad-based Emerging Markets outperformance this time has been the dismal state of the management of COVID-19 in many parts of the Emerging Markets, particularly Brazil and India. While a weaker Dollar will benefit commodity producers eventually, Russia is currently struggling with still very depressed crude oil prices.
That leaves China as the best-looking proxy play for Emerging Markets. It accounts for almost half of the MSCI Emerging Market index anyway. Indeed, with China’s GDP growing faster than the rest of the world – and that differential is likely to widen post-COVID-19 – there will be growing pressure to increase China’s weight in the MSCI Emerging Markets index. It is as of today already 42.5% of the index. Taiwan accounts for another 12.5% and South Korea 11.5%. As China’s GDP grows, it will in a few years overwhelm the index, making it look more like a China+ Index. At the moment, Brazil is only 4.8%, Russia is around 3% and India 8%.
There is now talk about separating China from the MSCI EM index, although the alternative is not immediately obvious, because whatever ex-Developed Markets index China goes into, it will likely overwhelm. For example, there is already an MSCI AC Asia Pacific ex-Japan Index, which includes Australia. Even there, China is already 40% of the index. But the point is, whatever happens to the EM index, China is already emerging as the only investible game in the Emerging Markets.
Vietnam, another EM country that has successfully managed the pandemic, could be another beneficiary of fund flows into Emerging Markets. It could indeed be a proxy for ASEAN, where many countries are still struggling with the pandemic.