The big news over the past couple of weeks has been the “shock” April print on US inflation. This is something we have been writing about for some time – that the massive fiscal and monetary stimulus in the Developed Markets will have inflationary consequences.
Now, the market’s attention will focus on whether this is “transitory” – as US Treasury Secretary Janet Yellen and a phalanx of Federal Reserve officials assure us – or whether this marks a historic end of nearly four decades of low inflation.
Our call is that this is not transitory and it has serious consequences for investments, living standards and political stability. Indeed, there is a confluence of a number of factors which could make this the “perfect storm” for inflation.
There is a long history of linkages between periods of high monetary growth and high inflation. We have seen a period of the greatest monetary expansion in US history and it isn’t even over yet. Unprecedented monetary expansion will be abetted by sharply higher commodity prices, supply chain disruptions, and an ongoing trade war between the US and China to push consumer prices much higher.
Highest m/m core inflation reading since Paul Volcker was head of the Fed. US CPI Inflation (all urban consumers, all items, seasonally adjusted) rose 0.8% m/m in April, accelerating from 0.6% m/m in March. This was the highest since June 2009. Over the 12 months to April, the all-items index increased 4.2% before seasonal adjustment, up from 2.6% in the 12 months to March. The April figure is the largest 12-month increase since September 2008.
The rise in the core inflation figure (excluding food and energy) was even more stunning – at 0.9% m/m, from 0.3% m/m in March. The last time we saw a higher figure was in 1982 – when the then Fed Chair Paul Volcker was forced to take a hammer to break the back of US inflation. The effective Fed funds rate was then almost 15%.
The 12-month core inflation figure is now 3%, despite it including data from the worst months of the pandemic last year. This is up dramatically from 1.6% for the 12-months to March.
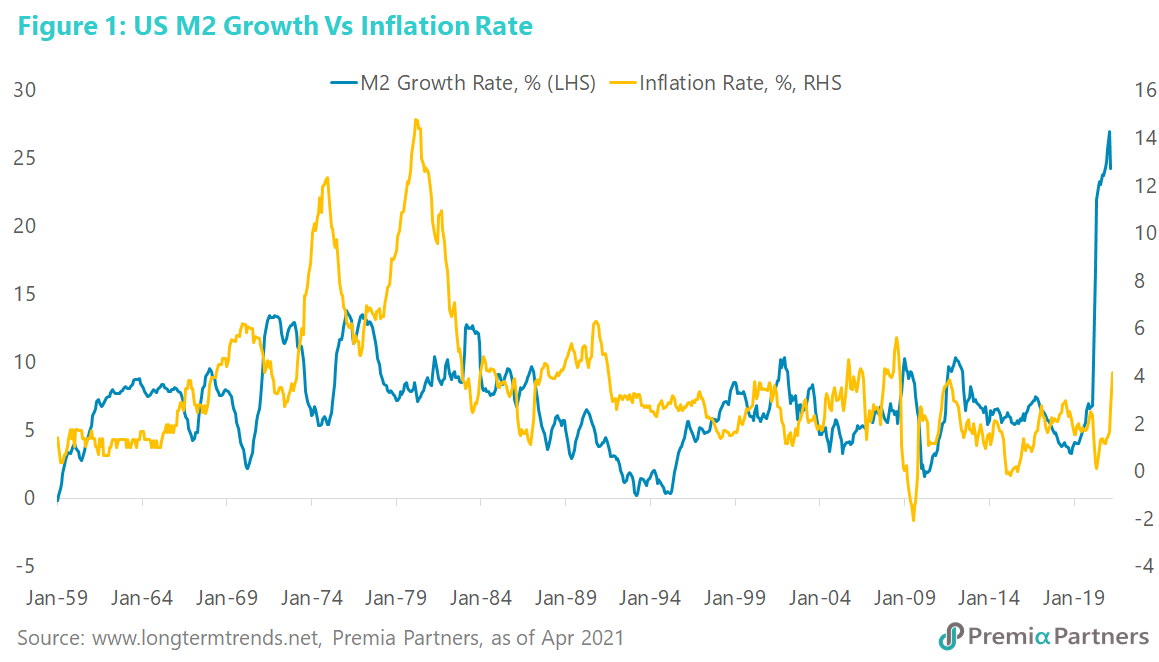
Unprecedented monetary shock will likely drive inflation much higher. The past 12 months has seen an unprecedented period of growth in US M2 money supply. US M2 money supply stock grew 30% from January 2020 to March 2021. This surpassed the previous peak of M2 growth of 24% y/y in 1943, in the midst of the Second World War.
There is a long historical relationship between US monetary expansion and inflation, much of which is related to responses to severe economic downturns and wars. It is not a perfect match, every time. But there is sufficient history of the relationship between rapid money supply growth and inflation in the US to take this seriously.
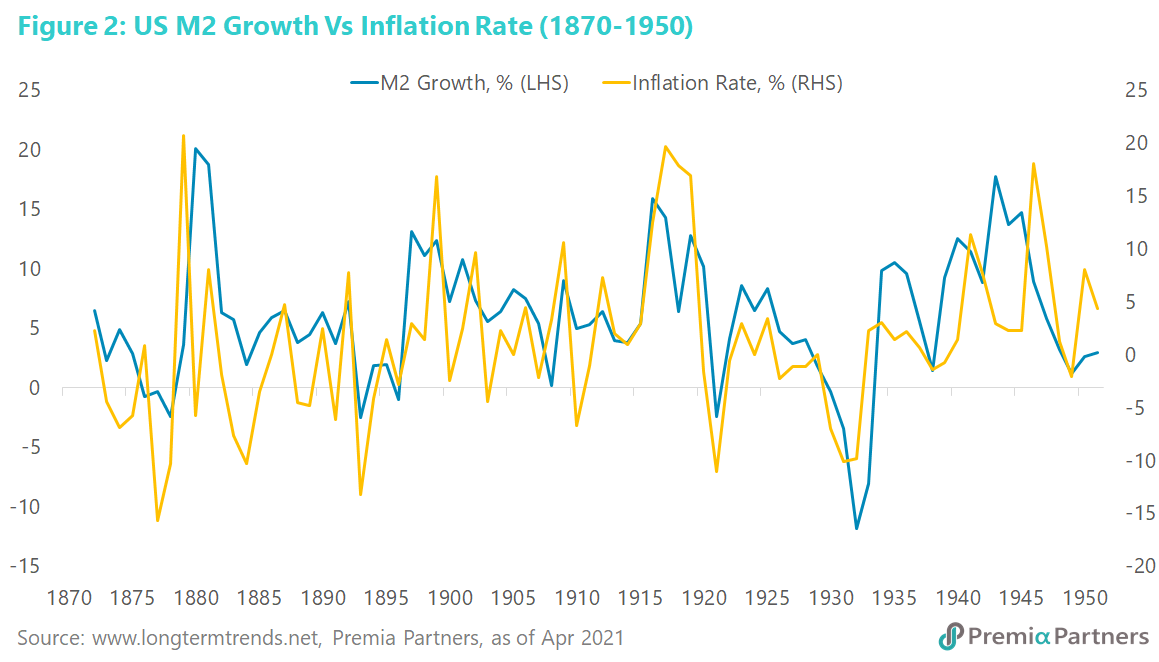
There are many examples of the link between monetary expansion and inflation, although the timing varies from episode to episode (that is, whether the correlations are coincident, leading or lagging). Here are some standout examples: In the late 1870s, towards the end of the so-called “Long Depression”, inflation spiked as M2 money supply growth started picking up. During the First World War, rapid monetary expansion drove inflation above 20%. During the following “Great Depression”, President Franklin Delano Roosevelt’s “New Deal” stimulus of 1933-1936 saw monetary expansion forcing up inflation again. Then during the Second World War, rapid monetary expansion to finance the war saw inflation surging, albeit with a lag, to almost 20% by 1947 (figure 1).
During the Vietnam War, two surges in money supply between 1970 and 1976 saw twin lagged spikes in inflation, culminating in inflation of over 14% by 1980 (figure 2) and Paul Volcker taking the effective Fed funds rate over 19% and the prime lending rate above 21%.
Since then, we have had a long period of low inflation despite three surges in monetary expansion coinciding with the Nasdaq Crash of 2000-2001, the Global Financial Crisis (GFC) of 2008-2009, and the post-GFC struggle for recovery.
Given the size of the monetary expansion this time – and it is worth repeating the word “unprecedented” – it would be reckless not to pay serious attention to this.
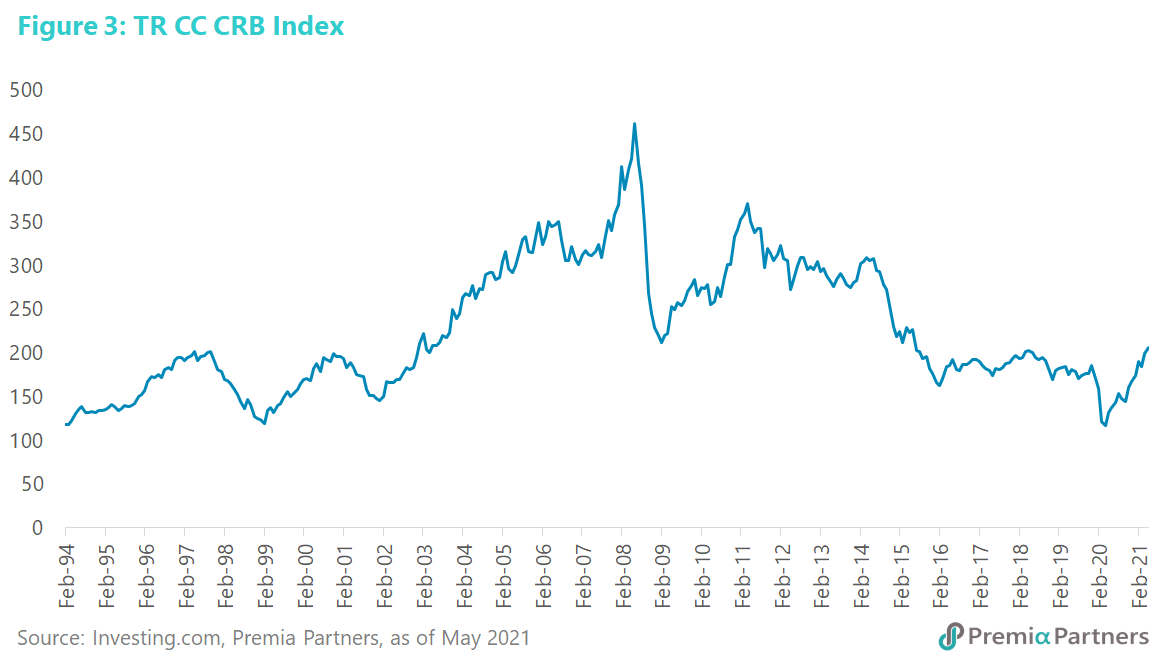
New commodities cycle has started. There have been five distinct cycles in commodities since 1994, as captured by the Thomson Reuters/CoreCommodity CRB Index (figure 3). By the start of last year, it looked as if the last cycle was close to running its course. Mining capital expenditure, having fallen sharply from 2014-2016 – coinciding with a massive price slump – had stabilised and started picking up by 2019, suggesting the beginning of a new cycle. Then the pandemic hit and it took the Thomson Reuters/CoreCommodity CRB Index to a new low.
We now appear to be at the beginning of a new cycle, with likely added vigor caused by fiscal stimulus in the world’s two largest economies, the US and China. The infrastructure spending in these economies will likely drive competition for commodities, inventory building and yet higher prices.
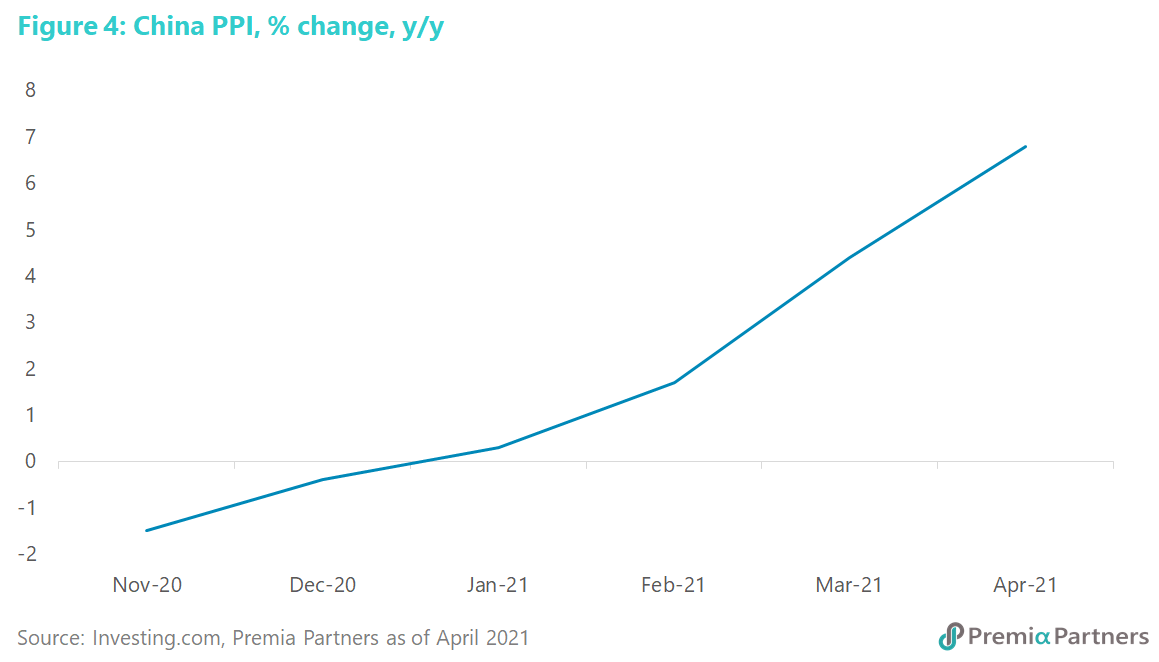
That has already started to flow through into both producer and consumer prices. Higher commodity prices – abetted by supply chain disruptions – recently shocked the economy through higher producer prices coming out of China (figure 4). With China focusing on growing domestic consumption, it is unlikely to absorb higher costs through either repressed wages or significantly lower margins. Chinese producers will continue to pass on the higher costs.
Supply chain disruptions and higher tariffs will add to inflationary pressures. A March 2021 survey by the Federal Reserve Bank of Atlanta found more than half of the firms surveyed experienced some form of supplier delay, and the level of disruption was "moderate to severe" for 40% of them. A third of firms indicated that they were having difficulties with their employees' availability for work, and a fifth indicated a lack of adequate supplies and inputs on hand, likely due to supplier delays. According to the Atlanta Fed, firms also appear to anticipate higher unit-cost growth in the year ahead. Since hitting a low in April 2020, firms' unit-cost expectations for the year ahead have surged to an all-time high by March 2021.
The tariffs imposed by the US and China on one another’s exports will add a bit more upside pressure to prices. According to research by Barry Naisbitt and Kemar Whyte, as published by the National Institute of Economic Review, the consumer price inflation rate both in the US and China would increase by about 0.2 percentage points relative to the baseline projection over three years following a 15 per cent increase in tariffs. According to the Peterson Institute for International Economics, average US tariffs on Chinese goods increased from 3.1% early-2018 to 19.3% currently. The average tariff imposed by China on US goods has gone up from 8% to 20.7% over the same period.
Equities will likely tolerate higher inflation in its early stages, while GDP and earnings are growing rapidly.
The risk to equities is rising but the upward cycle is unlikely to end just yet. There is a seasonal element – the pre-summer sell-off – in the current market volatility. On balance, it should pass as the Fed continues to talk down inflation as “transitory”, maintain expectations of zero rates for longer, and buy down Treasury bond yields.
Currently, the S&P 500 trailing 12-months (TTM) earnings yield is around 2.3% and the 10Y UST yield is now around 1.6%. Yes, this is a narrow “spread” but it will likely get narrower. The danger zone is like where the 10Y UST yield and the TTM earnings yield intersects. Bullish next 12-months (NTM) earnings yields will also provide a further buffer.
There should be a difference between inflation in a rapidly growing economy and inflation in a slowing or stagnant economy. We are currently in the former. This is pro-cyclical inflation, rather than counter-cyclical inflation. Equities will likely tolerate inflation better when GDP and corporate earnings growth rates are high.
In the same vein, historically, US equities have tended to go up in the early stages of rises in the 10-year UST yield. At the later stages of the rise, problems emerge when higher borrowing costs choke off economic activity, and bond yields make equities no longer attractive. It is likely that we are not there yet.
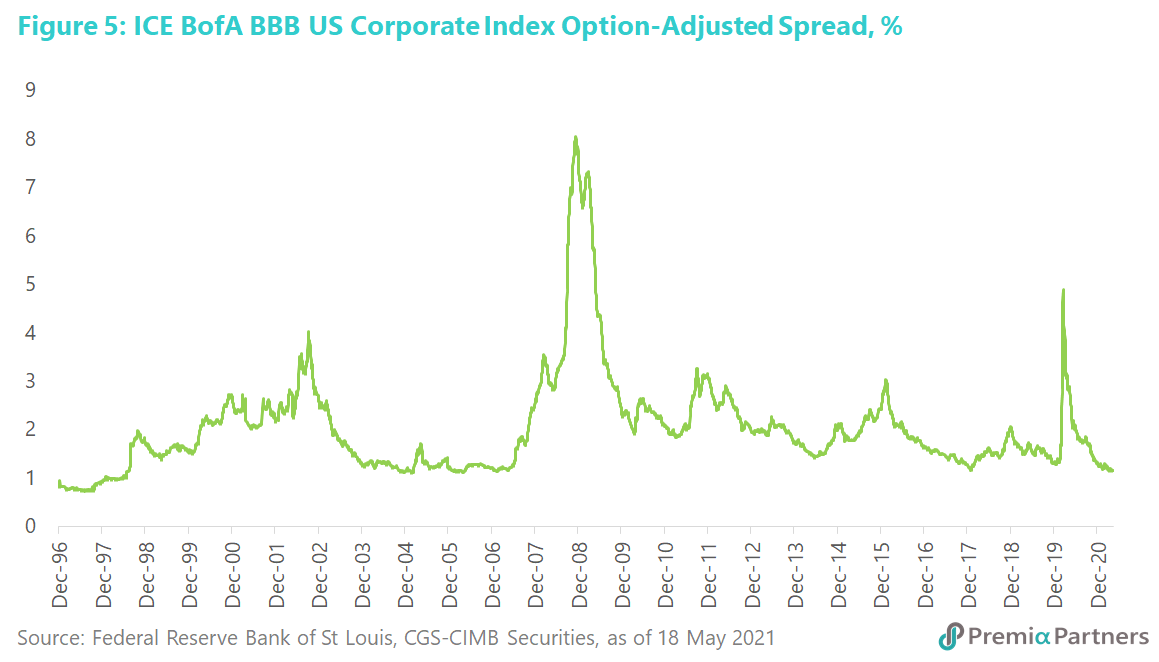
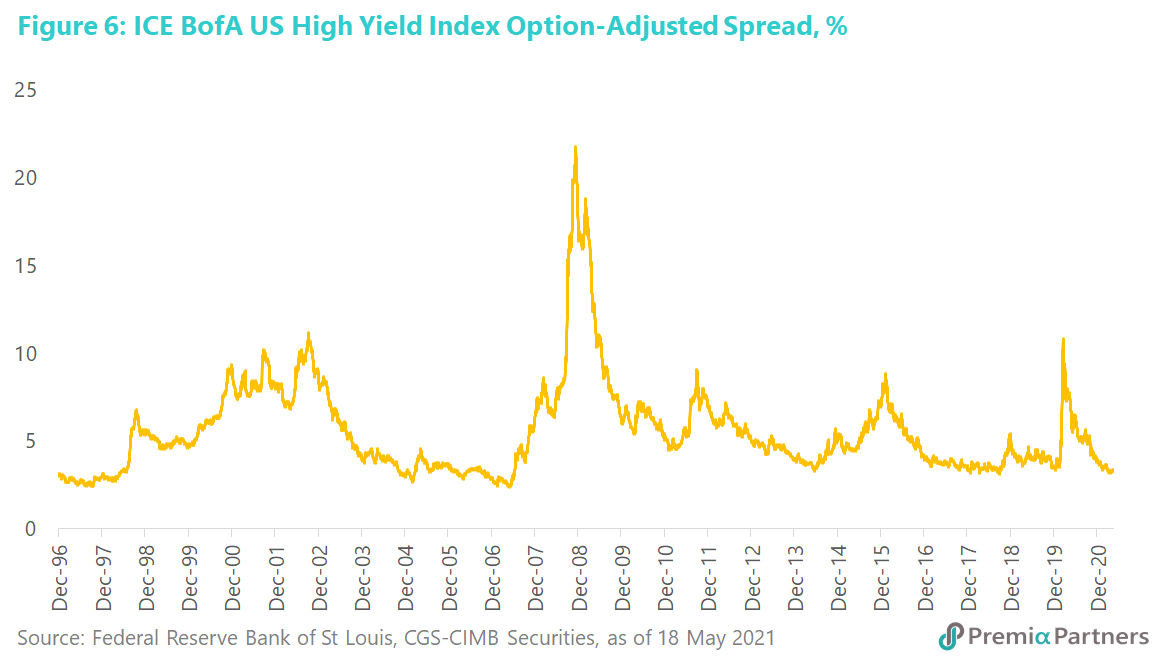
The outlook for Developed Market bonds is very worrying. Even if the Fed moderates the rise in the 10-year UST yield, as we expect, a creeping ascent in that yield can still do considerable damage to corporate credits, given the ultra-low spreads at the moment for both DM investment grade and high yield credits. In the big cycles of US corporate credit spreads, we are at extreme lows. In risk management terms, DM corporate credits makes little sense: it seems there is little room for them to move lower, but a lot of room for them to move higher (figures 5, 6).