Now that I no longer work for a large corporation, I go to great lengths to find reasonable cost accommodation for business travel. It simply doesn’t make sense for us at Premia Partners to spend what I used to on hotels. My latest find is a hotel undergoing renovation for the 21st century – the hotel app on my phone has my keycard for elevators and doors. I can control the room temperature, lights, TV and soon they’ll turn on room service, which means I’ll be able to order dinner right after my last meeting to arrive by the time I get back to the hotel. And the best part – it’s much cheaper than the hotel I used to stay at just a few months ago down the road.
Please forgive the random musings, but this analogy reminds me too much of our own plans at Premia. We are modernizing the Asian beta landscape and lowering costs as well. For those reading our past posts, you’ll know we are planning to list new A-share beta strategies, improving on what exists today in both design and cost. We are finally at our destination, with HKEx listing scheduled for Oct 24 subject to final regulatory approvals. We’ll officially announce the tickers upon final SFC approval next week, but I’d like to use this post to explain why we’re starting with A-shares and to do a deep dive into our mainstream economy strategy based on the CSI Caixin Bedrock Economy Index.
Why start with A-shares and why are existing options not ideal?
Most investors today use A-shares beta strategies that follow either the FTSE A50 or the CSI 300. Some are looking at MSCI China A. We see multiple challenges in this approach:
- Unlike the US, China's economy is not efficiently captured through market-cap
- All three benchmarks are effectively mega-cap focused
- FTSE A50 is only the top 50 stocks and is ~60% financials
- CSI 300 is top 300 stocks and only ~35% financials, but is ~60% SOEs
- MSCI China A sits somewhere in-between
- For these simple concepts, ETF investors pay average expense ratios of 1%!
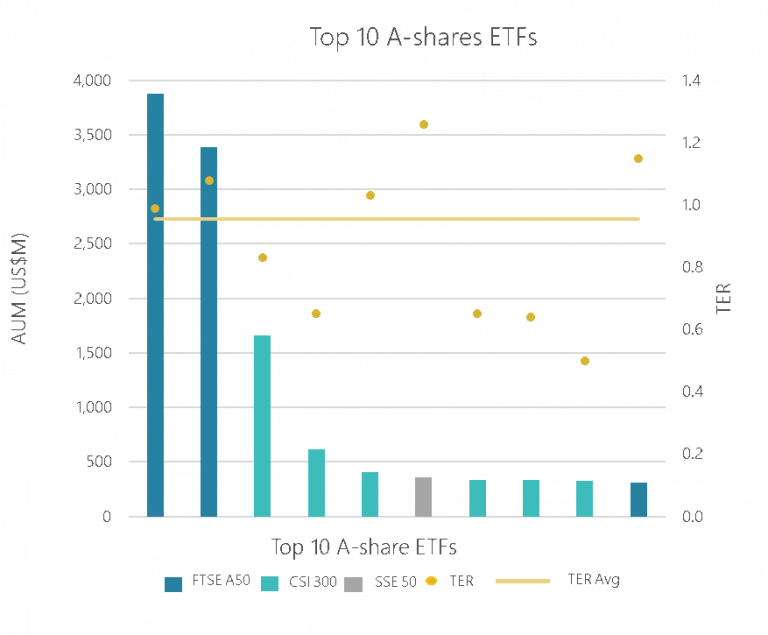
Source: Bloomberg; as of 2017/10/13
What are we doing about it?
First and foremost, we are stepping away from the market-cap approach. We strongly believe that a fundamental multi-factor approach is required to identify and size positions in a market where valuations are 90% driven by retail investors and are prone to overreaction. There is too much excess return left on the table with a market-cap methodology.
Second, we are capping expense ratios at 0.5%, a level that clients have told us makes sense for smart beta implementation in China. This makes us not only the most modern, but also one of the most cost-efficient options for investors, just like the hotel I’m typing this from.
Third, we are implementing a 100% physical solution through Stock Connect. This lowers transaction costs and reduces operational risk. We’ve also said no to derivatives, leverage and securities lending – simply the stocks in the benchmark and nothing else.
Last, and probably most critical, we don’t believe China can be covered with a one size fits all approach. It’s too complex a market (3,000+ stocks) and an economy (old vs new) so we are launching 2 strategies – Bedrock for mainstream economy and New Economy for, you guessed it, a new economy focus. Bedrock is a smart beta improvement on the benchmarks I mentioned above and New Economy is a sector tilt that avoids financials, real estate, staples and so on.
How do we build the benchmarks?
I’ll spend the rest of this post on the Bedrock strategy and will post New Economy in a few days. For both, though, we’ve partnered with Dr. Jason Hsu and his team at Rayliant Global Advisors, to design a multi-factor strategy that works for China and a isn’t a blind copy and paste from the US. So how does Bedrock work? It’s a 3-step process to build a universe that captures China’s economy better than a mega-cap market-cap index.
Step 1: Screen for economic size
- Instead of market cap, we identify the biggest contributors to the real economy
- 800 stocks are selected based on total assets, book value and revenue ex government subsidies
- This creates a value and size tilt vs traditional market cap benchmarks
Step 2: Apply relevant factors
- Narrow the 800 stocks down to 300, based on Financial Health and Low Volatility
- Our 5 Financial Health metrics ensure that only quality companies make the cut
- Debt Coverage – large debt servicing costs are not efficient
- Accruals & NOA – aggressive accounting leads to poor results long-term
- Cash Ratios & Profit Margin – low cash levels & profits decrease investment
- Our 3 Low Volatility metrics dampen the wild ride onshore
- 1Y Return Volatility – the company’s own volatility level
- 1Y Market Beta – the company’s beta to the broader A-shares market
- 1Y Downside Risk – the company’s volatility when markets are dropping
Step 3: Rebalance to follow fundamentals
- Use economic size, not market cap, to size positions
- Rebalance using audited financial statements, selling expensive companies and buying cheap ones
Does this really work?
Yes, but not just because we say so. Each of these metrics has been studied extensively in global markets, going back 50 years or more. They’ve also been tested for China performance. For example, you won’t find dividends in the above methodology – due to China specific regulations high dividend stocks actually underperform. Value, Quality, Low Size, Low Vol – these are all proven investment strategies that work even better in China as investors don’t yet implement them as widely as in developed markets.
How does Bedrock compare to other options?
Below is a table comparing Bedrock to CSI 300. Bedrock has better valuation metrics and a higher yield. Margins, revenues and debt coverage are higher. My personal favorite – Bedrock covers ~70% of profit listed in China. Last, and perhaps most important, the performance results are better over the long-run.
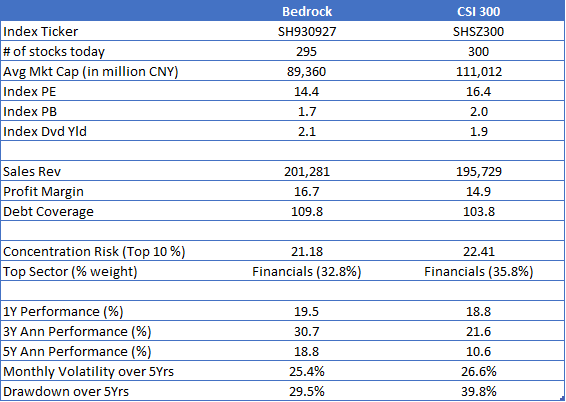
Source: Bloomberg, Premia Partners; as of 2017/06/30; Performance, volatility and drawdown measures utilize monthly total return from 2012/06/30 – 2017/06/30
Critically, this improvement in performance is not driven by sector differences. While both Bedrock and CSI 300 have a lower financials weight than FTSE A50, the sector differences between them are relatively minor. Bedrock’s better historical returns are not due to sector exposure shifts, but by its impact on security selection. Only 154 stocks overlap between Bedrock and CSI 300, leading to an active share of 48%.
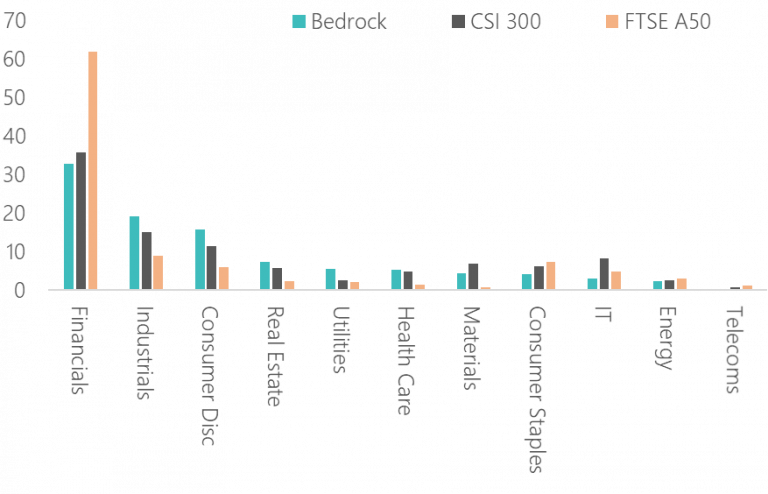
Source: Bloomberg, Premia Partners; as of 2017/06/30
Is performance consistent and how does it compare to active funds?
On this, we offer 2 data points. First, we calculate Bedrock’s batting average vs CSI 300, comparing their returns over a variety of rolling periods since 2005. The results are clear: Bedrock outperforms, leading to a Sharpe Ratio of 0.73 (vs 0.45 for CSI 300).
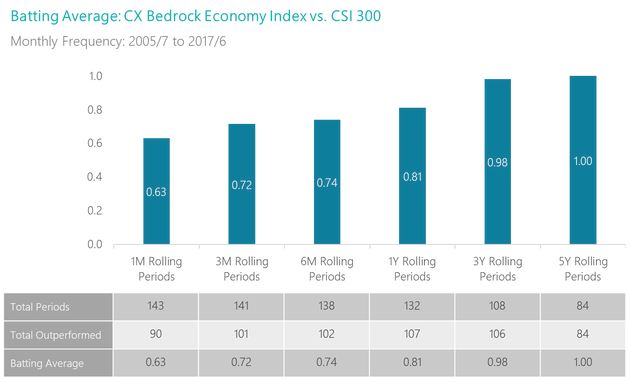
Source: Bloomberg, Premia Partners; as of 2017/06/30
Second, not only does Bedrock beat CSI 300, but it does quite well vs the active A-share fund universe as well. There are of course funds that outperform, but the category as a whole does not deliver alpha net of fees.
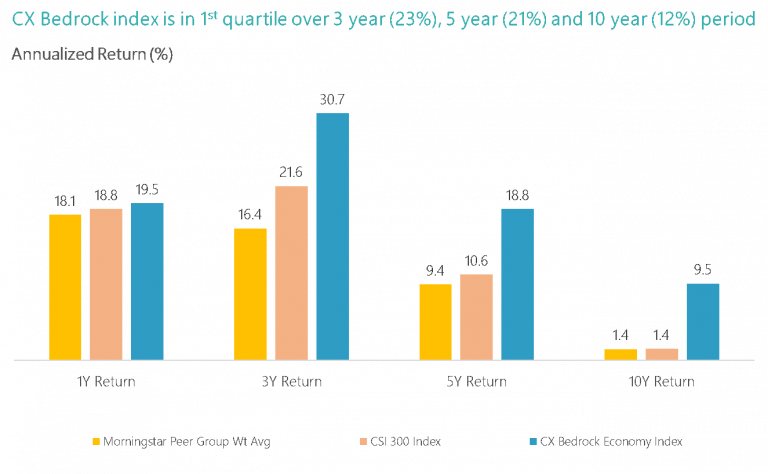
Source: Bloomberg, Premia Partners; as of 2017/06/30
If you invest in A-shares via ETFs, you’ll likely agree with our thesis – existing products leave a lot to be desired. That is why we chose this approach – an A-shares solution that represents China’s mainstream economy, costs less and captures excess returns via a multi-factor fundamental build.
If you have any questions, don’t hesitate to reach out our way. Next week, we’ll talk about New Economy and why in China a market cap tech benchmark doesn't work.

