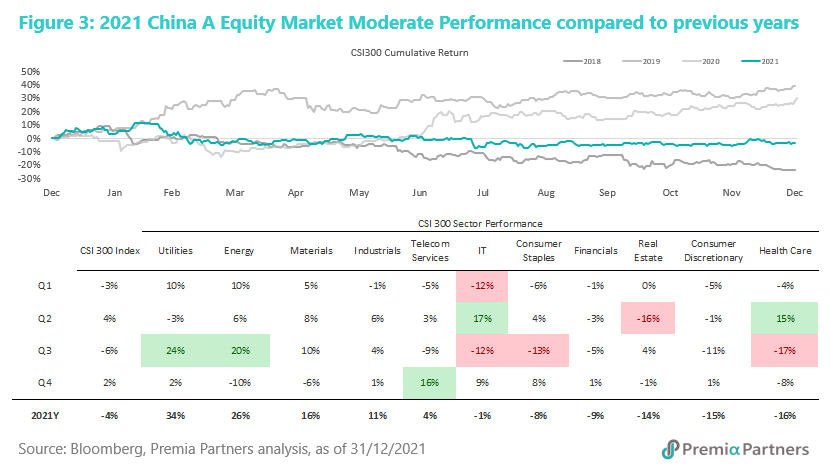
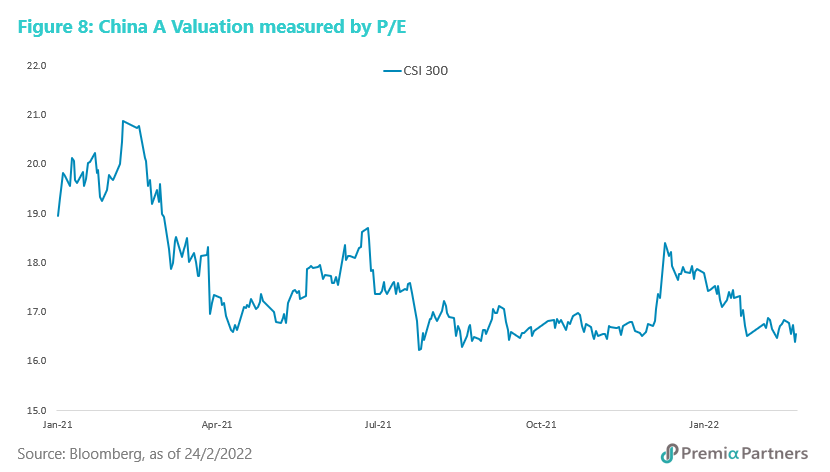
China A wrapped up the fourth quarter 2021 with positive returns of 2% for CSI 300, narrowing full year 2021 negative return to -4%. This was after much headwinds in the first half of the year, when we saw GDP growth in China peaking in Q1, followed by downward pressure and elevated PPI inflation as a result of surging commodity prices. Meanwhile CPI inflation remained mild at below 2%, contrary to heightened inflation risks in the US and the western world.
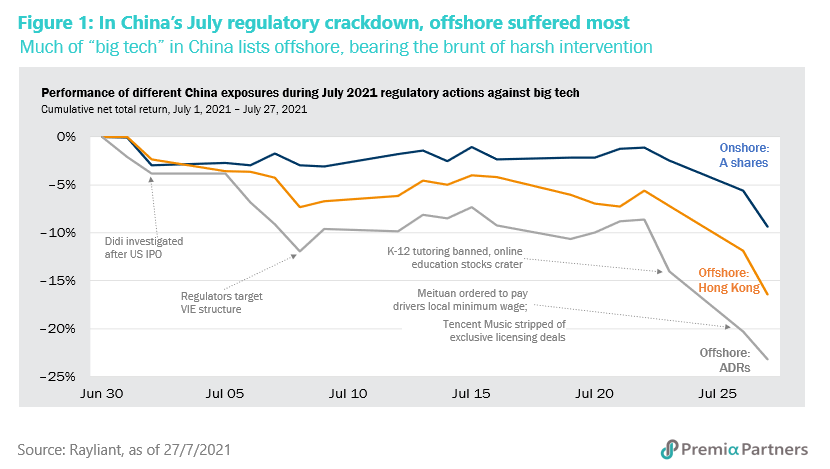
2021 has been a challenging year for many, with significant divergence within the Chinese equities universe and frequent growth/ value factor rotations through each quarter. The much better resilience of onshore China A market in Q2 and Q3, compared to offshore China markets (ADR and H shares) amid regulatory crackdown and antitrust investigations on big tech names and education sector, underscored the importance of differentiating those under policy headwinds versus those under policy tailwinds.
In fact, with tightening of big data and cybersecurity laws and the common prosperity paradigm, from platform economy companies, sharing economy sectors across ride-sharing, bike-sharing and home-sharing, to gaming and entertainment sectors, many of the previous offshore listed Growth favourites saw brutal valuation resets and severe drawdown.
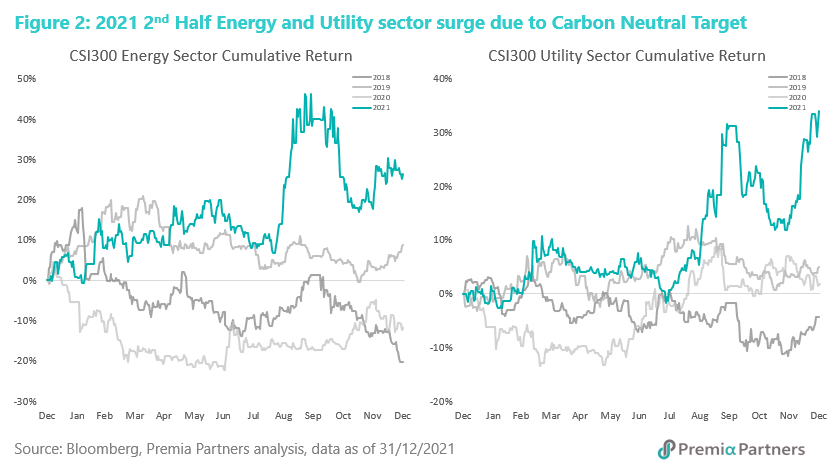
Meanwhile the traditional value stocks in Energy and Utility sectors in China A much benefited from rising coal and electricity prices in Q3, as the abrupt enforcement of carbon reduction targets imposed by many local governments triggered coal supply shortages and power suspension which was subsequently relieved in Q4 when the National Energy Administration (NEA) relaxed coal supplies.
Such value/ growth mean reversion also exhibited in the quarter-by-quarter performance of the broader China A markets. Figure 3 outlined the performance of Top and Bottom 5 sectors through each quarter. Here we observed within the Growth sectors of IT/Health Care and Value sectors of Utility/Energy/Material, significant drawdown in one quarter typically followed by strong rebound in the following quarter, as Growth/ Value rotation contributed to the performance during the period.
Factor performance behaviour
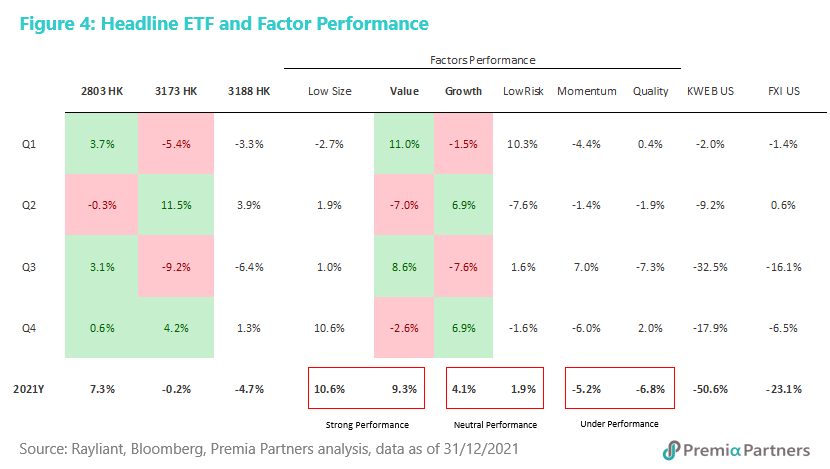
At the factor level, Low Size and Value were the best performers with +11%/+9% return in 2021 while Growth and LowRisk returned with mid-single digit positive returns. Meanwhile, Quality and Momentum factor were the major laggards – this perhaps surprising observation, could be the result of a period when the government policies rather than company fundamentals dictated performance, and which were also difficult to be captured by momentum trades.
Zooming in on the Value/Growth Rotations
As aforesaid, we have seen Value/Growth factor rotation quarter by quarter throughout 2021.
Value started off Q1 with strong rally, as talks of the imminent interest rate hikes in the US triggered investors risk reduction exercise during the period. Sectors like Energy and Materials benefited from global commodity price surge amid expectations of US economic recovery upon reopening. On the contrary, growth stocks became a victim as investor appetite for expensive and unprofitable growth stocks waned ahead of interest rate hike kicking in.
After the mild correction at the beginning of the year, Growth stocks in policy supported sectors returned with strong performance by buy on dip and GARP investors. Health care, Semi/IT and New Energy, those exhibiting clear growth style outperformed value stocks especially those under strong policy support as indicated in the 14th Five-Year-Plan. Value instead, after the strong rally of 11% in Q1, experienced heavy correction of -7% instead returning most of the previous gains.
Q3 was the watershed period for most investors with heavy exposure to the offshore China space, as we saw unprecedented regulatory crackdown on offshore listed internet and education sector names like Tencent, Alibaba and the after school tutoring ADRs. This also generated spilled over fear selloffs for onshore new economy favourites, as investors turned risk off.
The conventional economy was not spared either, as we experienced market shocks in reaction to scheduled power suspension as fire drills for 2030 carbon reduction and 2060 carbon neutral targets set by the local authorities. That said, on balance through the period, onshore A-shares markets have been much more resilient in comparison, especially for onshore listed companies that are in policy tailwind sectors which businesses align with the strategic goals under China’s 14th Five Year Plans. Interestingly, there were silver lining beneficiaries during this period, as we have seen rotation back to ostensibly value sectors like Energy and Utilities as well in China during Q3 (Figure 2) on the back of supply backshift causing electricity power suspension and coal price soaring.
After the more traumatic Q3, rotation from Value back to Growth in Q4 could mainly be attributed to comparatively calm period in terms of regulatory crackdown, and monetary easing measures to lift the economy from the downward pressure for growth. Economic stability was much discussed on the market as Chinese government set the policy tone for 2022. After the meaningful valuation reset in the past quarters, market appetite for China A also started to return, as investors gradually rebuild positions in Growth and Cyclical sector leaders trading at attractive historical valuation.
Correlation behaviour in conjunction with Policies
We assessed the factor behaviour in a pronounced policy-driven environment in 2020 under COVID periods in our 2020 China A Factor Review, and we would like to provide an update for 2021 as we had seen policies continued throughout 2021. These policies created lots of headwinds and tailwinds for economies and equity markets.
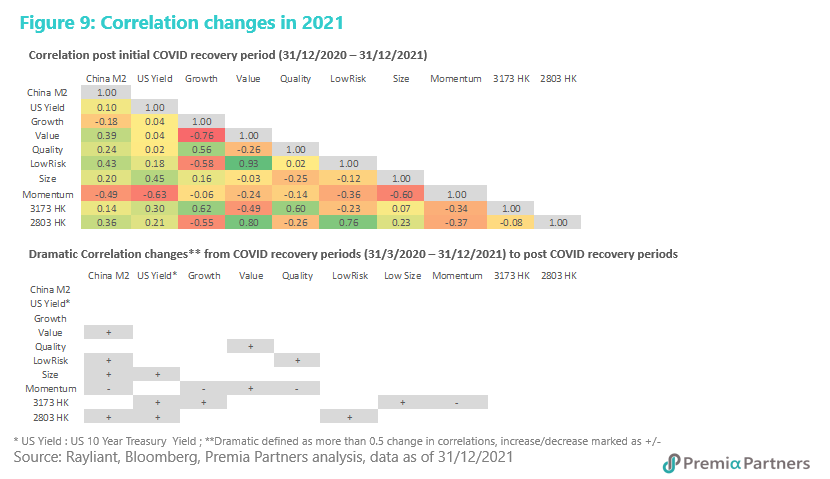
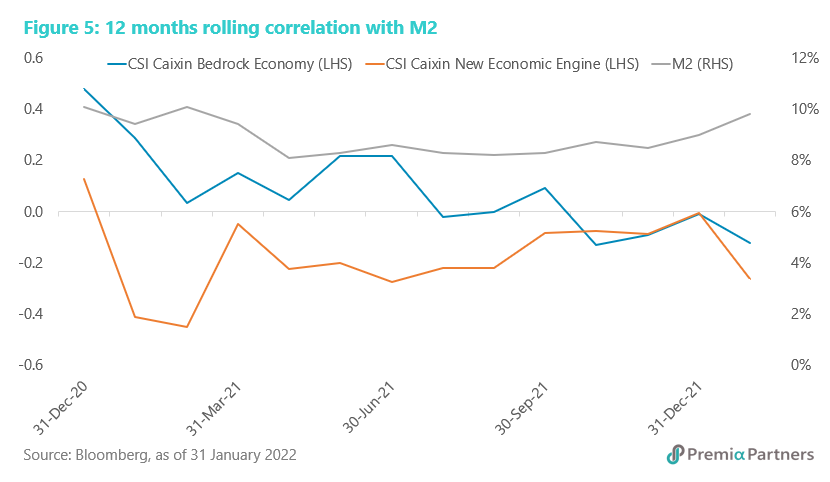
Note to chart: the bottom table in Figure 5 shows whether there were dramatic correlation changes from initial COVID recovery period to post recovery. We mark “+” and “-“ for more-than-0.5 increase or decrease in correlation.
We found although there was an increase in correlation between China M2 and US Yield, it remained low in the 2021 post COVID recovery. This was reflective of different monetary policy imposed by China and US.
We observed much increased correlation between China M2 and Factors except Momentum and Growth. These demonstrated that targeted liquidity measures had been reflected successfully in the capital market in 2021. Our China A Factor ETFs were also showing the similar patterns.
Interestingly, we also observed positive correlation between US Yield and our ETFs. With the much-anticipated interest rate hike in US in 2022, our ETFs are expected to benefit from this observation.
Momentum correlation decreased much against Value/LowRisk and increased against Growth/Quality from pre-COVID (before 2020) to COVID recovery period (2020). This explained that the investors favoured the Growth stocks, and had less interests in the Value and LowRisk ones during the pandemic when global equities markets also went on unprecedented rally.
However, the behaviour was reversed from 2020 to 2021. The correlation decreased against Growth/Quality and increase against Value although still negative. This explained the fact that under the stagflation economic environment in China, investors start to shift their focus back to Value and LowRisk stocks.
Premia Partners New Economy ETF and Bedrock Economy ETF
Both our Premia CSI Caixin China New Economy ETF (3173 HK) and Premia CSI Caixin China Bedrock Economy ETF (2803 HK) outperformed broader China A market by +5% and +12% respectively for calendar year 2021 and were even more significant against offshore listed China ETFs such as offshore China Internet (outperformed KWEB US by +51%/+58%) and offshore China 50 (outperformed FXI US by +23%/+30%).
Figure 6 shows the factor attribution for both ETFs performance against Broader China A equity market quarter by quarter to provide some granular explanation. To start with the whole year attribution, New Economy ETF gained on Low Size, Growth, Quality and Low Risk offset by having broader market exposure (beta) and underweight in Value factor. Whilst Bedrock Economy ETF gained on all invested factors except having market exposure (beta).
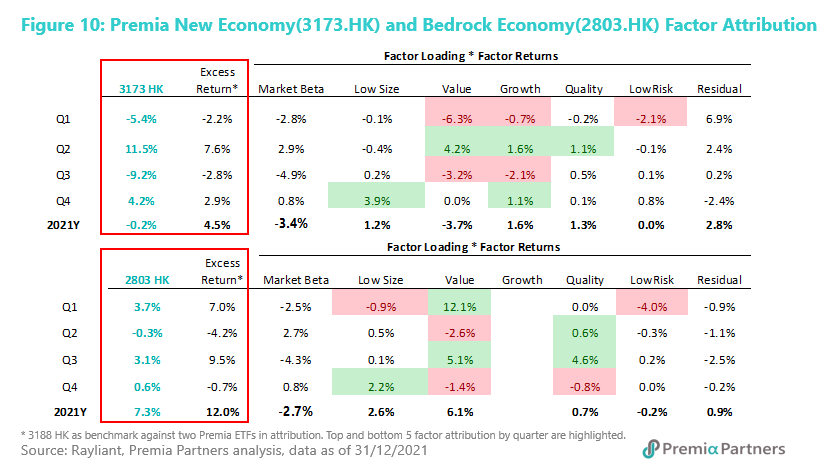
We have seen while Value/Growth factor raw returns (Figure 4) were in different signs within the same quarter for each quarter, factor attribution for New Economy ETF active returns were in the same direction, i.e. Value and Growth factor both contributed or detracted in the same quarter. This is due to that our New Economy ETF has positive tilt towards Growth factor and has less weight in Value factor when compared to broader market. When the opposite sign active exposure in Value and Growth experienced opposite factor performance each quarter, they both contributed or detracted.
While Quality as a standalone factor wasn’t appealing as we have seen from raw factor return being -7% for 2021 (Figure 4), we want to emphasise its importance as an auxiliary factor in conjunction with other factors. Indeed, the invested Quality factor contribution when combined with other factors to both ETFs each quarter and Year 2021 were positive.
2021 has been yet another Event/Policy Heavy year, factor and sector returns experienced extraordinary return deviations when such events occurred. A well pronounced event would be the power shortages in a lot of cities caused by coal supply restriction. Energy Sector/Utility sector and Value factor experienced more than 3 standard deviation movements during the period. Due to the nature of the return-based factor attribution, we see the Residual factor, which measures the idiosyncratic part of the return, being a significant contributor to total active returns.
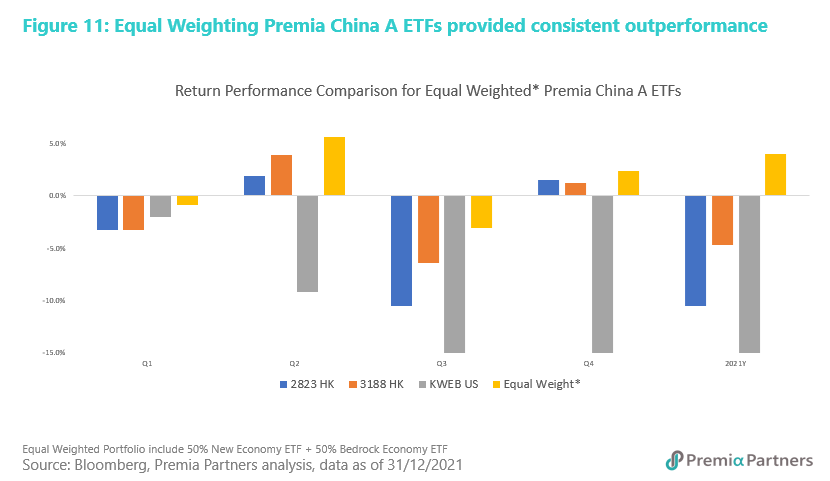
Our New Economy ETF and Bedrock ETF focus on different economic drivers of China where investors may use the two as asset allocation tool to toggle between the two under different environments. However, timing is difficult without hindsight, one cannot always predict the future in such a policy heavy environment. We would like to illustrate a blended portfolio which consists of 50% New Economy ETF and 50% Bedrock Economy ETF which would outperform the broader market and its peers consistently (Figure 7).
Looking ahead and investment case for China A
“Growth Stability” is one of the keywords for China 2022, according to the tone-setting Central Economic Work Conference held in late 2021. This implies the continued importance of policy support and market liquidity in China.
Different from US inflation situation and hawkish rate hike anticipating, China’s CPI and PPI still stands at relatively low level and more room to easing. Monetary policy will remain moderately adequate in 2022, with stabilizing economic growth being the primary goal.
After appreciating ~3% in 2021, while it may appear difficult for RMB exchange rate against USD to continue to strengthen in the same magnitude in 2022, there are a few things worth noting. China’s monetary policy is stable, and international and regional exports remain very strong. On the capital markets front, equity and bond index inclusion, as well as increasing comfort international investors have for Chinese government bonds which have exhibited much more stability against market to market risk and price per volatility, also provide strong support for RMB assets by international investors. Domestically, the objective of stabilizing growth and targeted liquidity easing also more precisely support the fundamentals of the country’s economic growth. All these are likely to support the case of a stable rather than depreciating RMB.
Since the end of 2021, China’s equity market has experienced correction which has brought valuation back to attractive level.
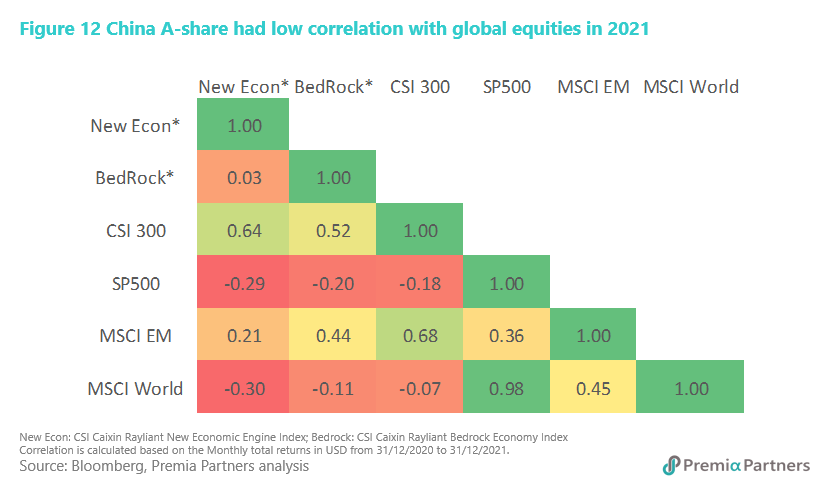
Finally as a very much under-owned space by global investors, the diversification benefits from China A share in 2021 still holds and has become even more pronounced (Figure 8). It was a compelling case for international investors to gain China exposure given the US and Developed Markets historically high Inflation situation and monetary tightening ahead will likely depress their capital markets – especially at this time when the absolute and relative valuation are also very attractive.