China: Signals from the investment surge
US sanctions on trade, technology and financial market access have done little to dampen foreign investor enthusiasm for China.
There has been a surge in foreign investment flows, both portfolio and direct, into China over the course of 2020: All of which begs the questions “why” and “how sustainable is this”?
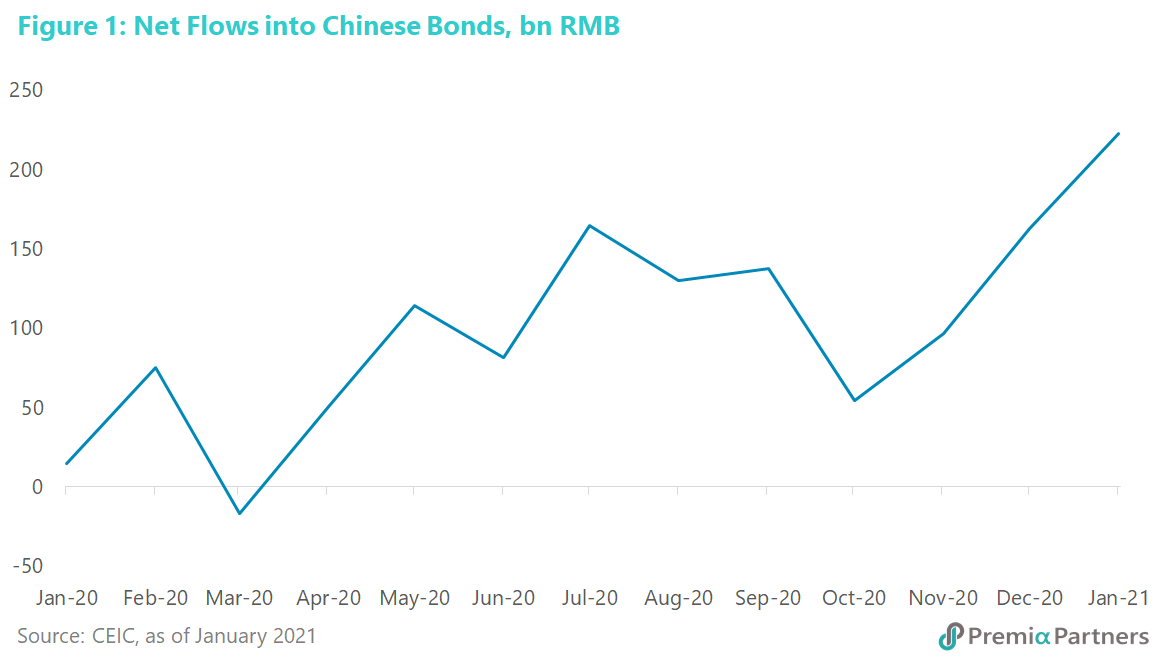
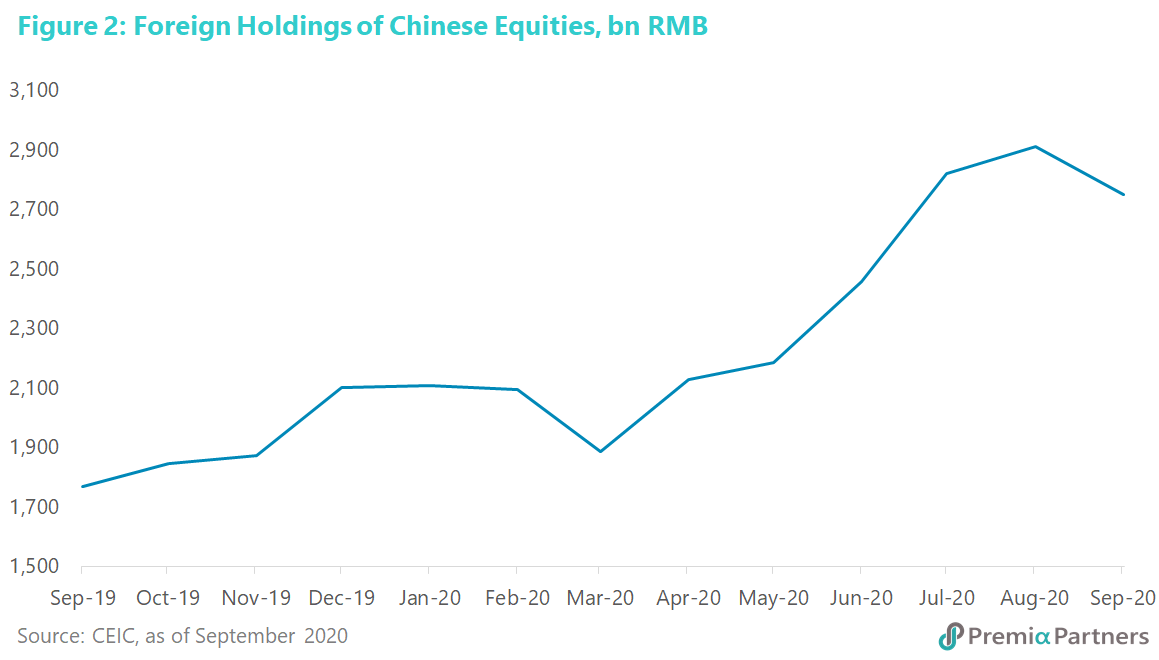
Foreign investment boom in China. Foreign investments in Chinese bonds have grown 58% over the 12 months to January 2021 (figure 1). Equities flows recorded an increase of 56% in the 12 months to September 2020 (figure 2), which is the last date for which data is available.
Meanwhile, according to United Nations data, foreign direct investments into China rose 4% last year, in a year when flows fell by 42% at the global level, with the US recording a 49% decline in new investment inflows by overseas businesses.
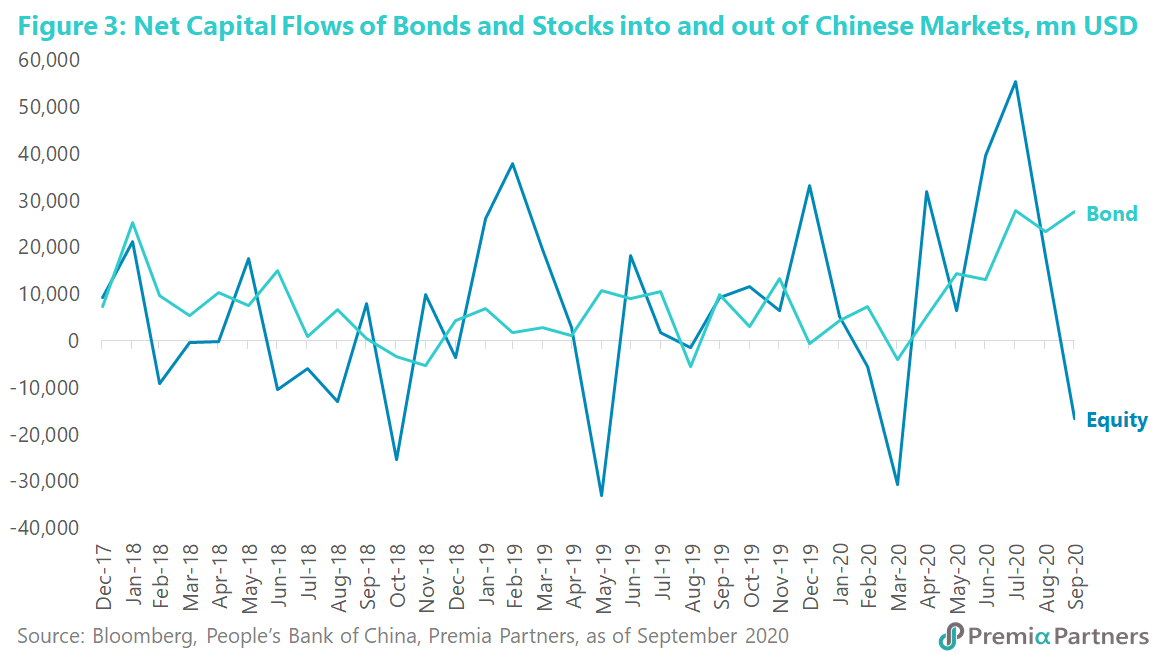
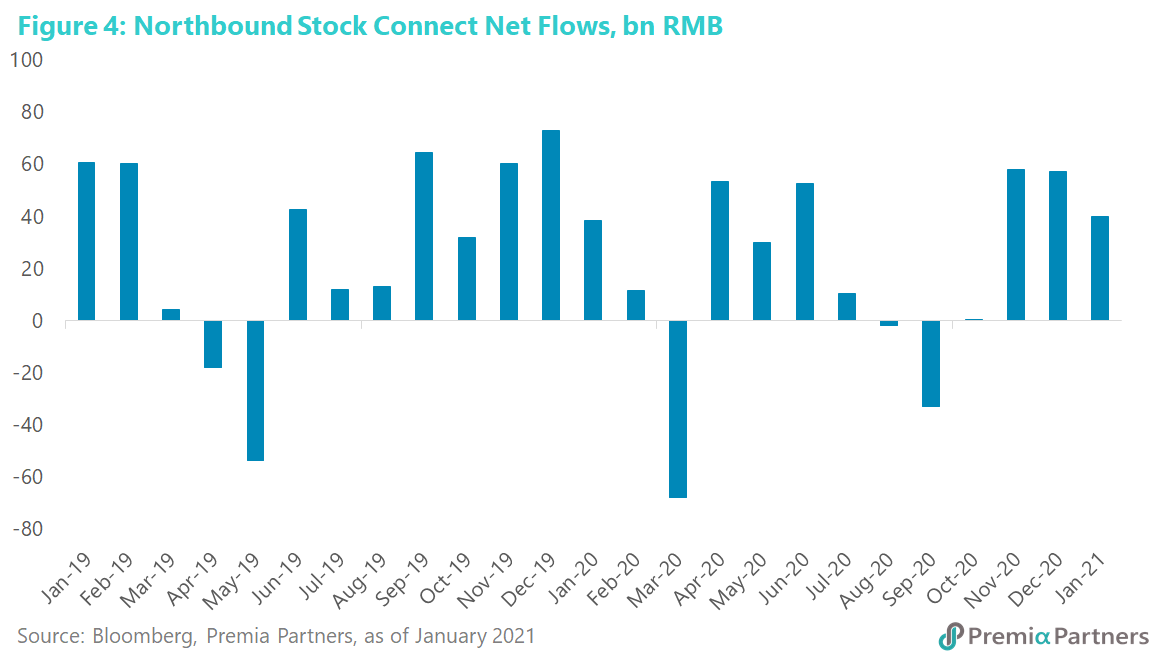
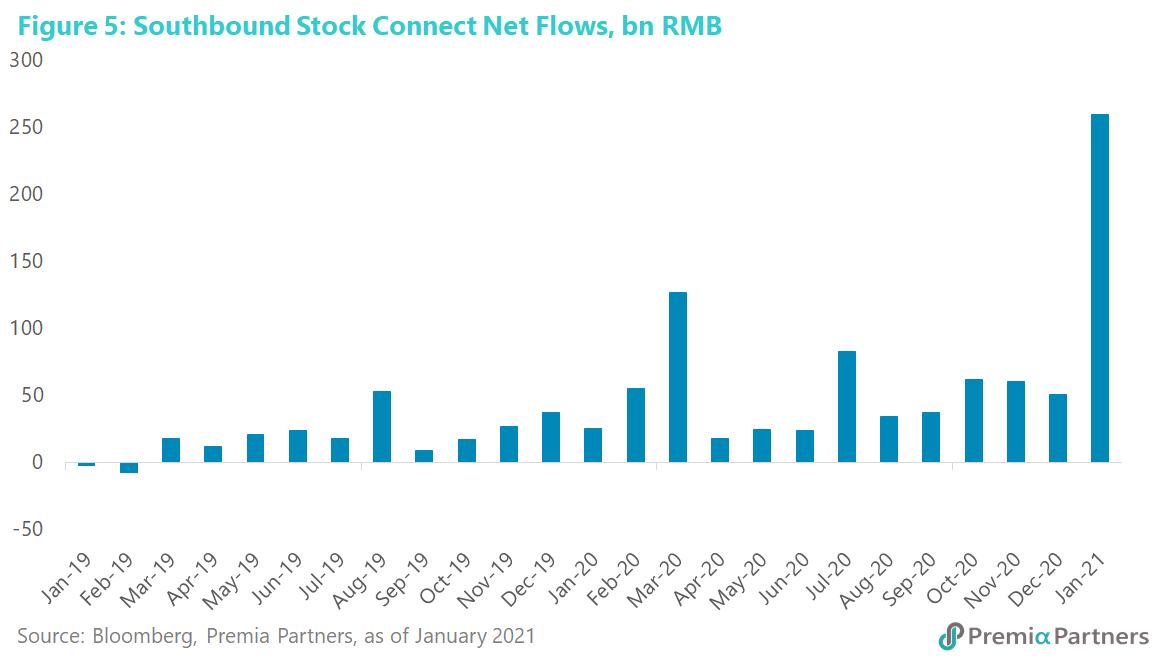
On the portfolio front, although there appeared to have been a net equities outflow from China from 3Q20, this appears to have been a function of Southbound Chinese portfolio flows into Hong Kong under the Stock Connect outpacing Northbound flows (figures 3, 4, 5). This is of course only a technical distinction, with funds still circulating within China.
Over the past 12-months, the CSI 300 has outperformed the S&P 500, by 39% versus 16%. Over the past six months, CSI 300 gained 24% against 15% for the S&P 500. Year-to-date, CSI 300 is up 11% versus 4% for the S&P 500.
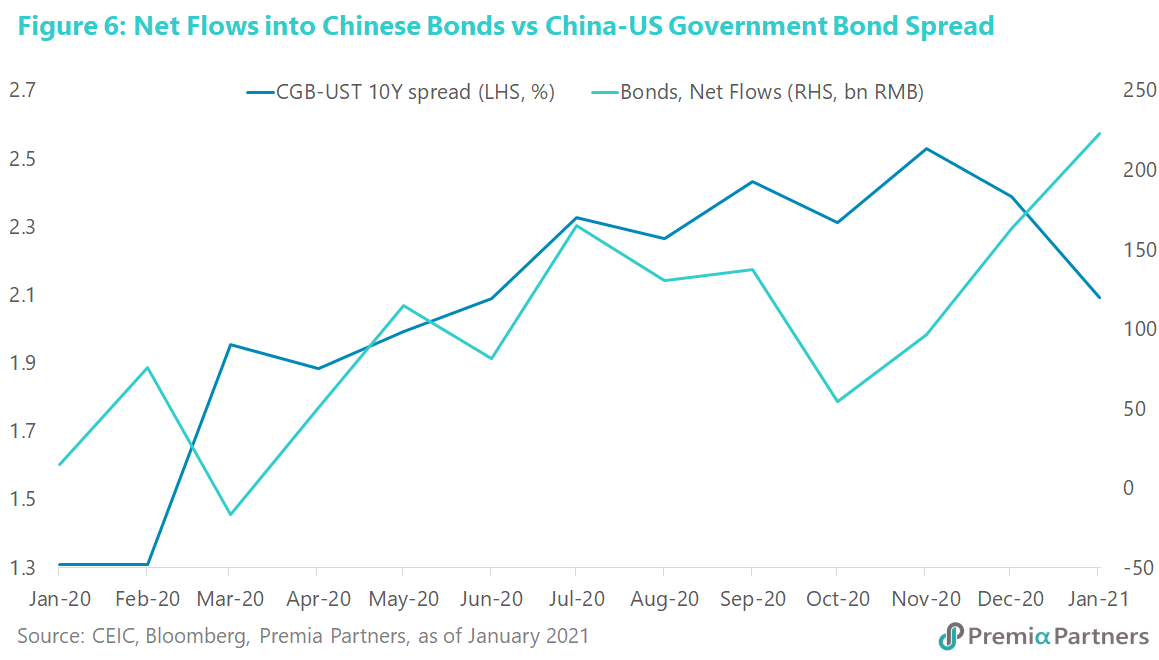
Government bond yield spread as a driver and mirror. Part of the foreign investment boom in China has been driven by the strongly positive yield spread between the 10-year China Government Bond (CGB) and the 10-year US Treasury (UST), which is currently around 193 basis points, having come off from a peak of around 250 basis points from July last year (figure 6). That makes sense in terms of the bond inflows.
The larger government bond yield spread was not a direct driver of higher Chinese equities prices, but it was a mirror: The relationship here appears to be the yield spread reflecting greater confidence in the recovery prospects for the Chinese economy versus the US economy.
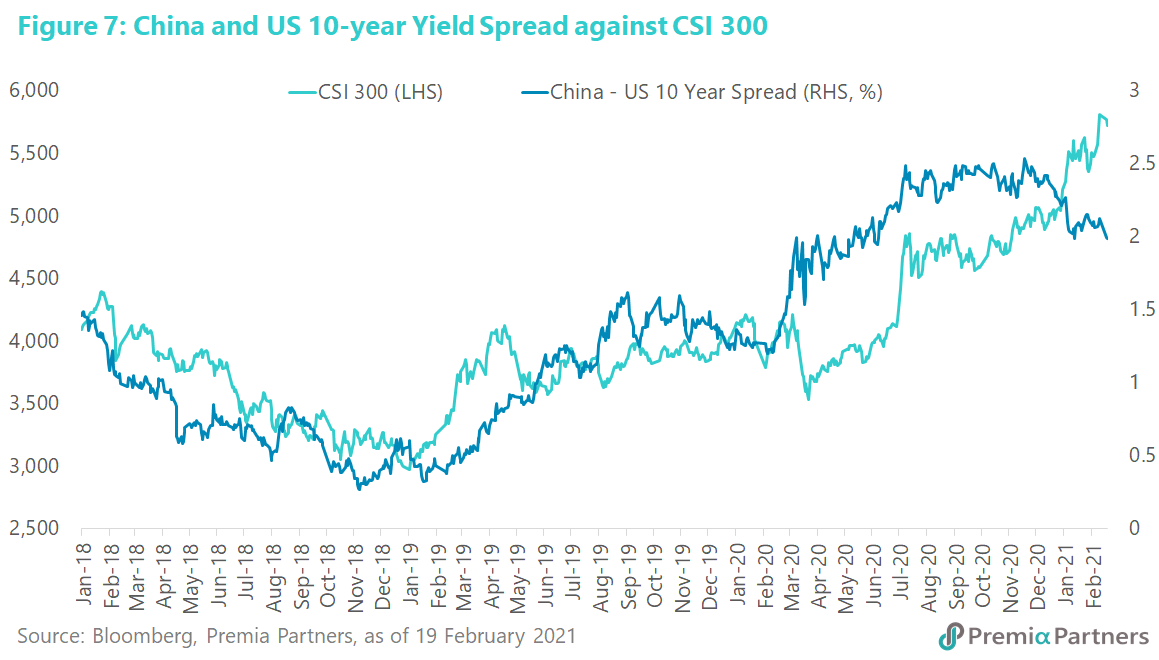
Chinese stocks continued to outperform despite a narrowing of that spread over the past six months. There has been a correlation between the government bond yield spread (the CGB 10Y minus the UST 10Y) and the CSI 300 – a higher spread tended to drive a higher CSI300 index and vice versa. But that relationship blurred from July last year, when the spread trekked sideways, and from November 2020 onwards, it narrowed. However, the CSI 300 pushed yet higher despite that narrowing of the spread (figure 7). Indeed, over the past six months, the CSI 300 still outperformed the S&P 500 – with the CSI 300 up 24% against the S&P 500’s 15%. Since November 23, when that spread started to narrow, the CSI 300 picked up 15.5% versus the S&P 500’s 9.2% gain.
Can the divergence between the government bond yield spread and Chinese assets continue? There are a few other factors which will come into play to decide this:
1) Judgments about growth relativities. The market’s judgement seems to be that even with the narrowing of the government bond spread, China would continue to have a strong growth advantage over the US and indeed, other Developed Markets. That has played out in the year 2020 GDP figures, with the forecasts for 2021 continuing that expectation. The International Monetary Fund is expecting 8.1% GDP growth for China for 2021, after 2.3% in 2020. This compares with 5.1% for the US, after -3.4% in 2020.
2) The ultra-efficiency narrative. China’s management of the pandemic, and the consequent early reopening of its economy, prompted an ultra-efficiency narrative which was reinforced by the widening of China’s trade surplus with the US in 2020, despite the trade war. China’s trade surplus with the US rose 7.1% to US$317 billion, fueled by pandemic demand for electronics, medical equipment and PPE (personal protective equipment) – driving the theme of China as the indispensable manufacturer.
3) Restoring supply through administrative measures instead of creating demand through monetary expansion. Failure to curb the spread of the virus caused shutdowns in many economies in the Developed Markets. It then forced policy makers to attempt to replace lost demand through massive welfare spending funded by extreme monetary expansion. That failed because much of the fiscal dollars ended piling up in bank accounts as the velocity of money plummeted.
Notwithstanding their ineffectiveness, these polices created distortions of market signals via accelerated quantitative easing, and in Japan and Australia, yield curve control. China avoided that level of distortion of rates and bond yields by managing the pandemic first to restore production/supply. Demand followed – not perfectly, but sufficiently to deliver 2.3% GDP growth.
4) Signals from bond market to currency market. The signals from higher relative government bond yields may have helped drive a stronger Renminbi, albeit with a lag. As net bond inflows rose from April of last year, USDCNY fell from 7.036 to 6.422 early this year.
Related to that is the arguably better risk-adjusted value found in CGBs compared to US junk bonds. The CGB 10-Year yield is currently still around 3.3%. Meanwhile, US high yield corporate bonds are averaging around 4.0%. That’s not a lot of yield pickup between “junk bonds” and an A+ rated (Standard & Poor’s rating) sovereign.
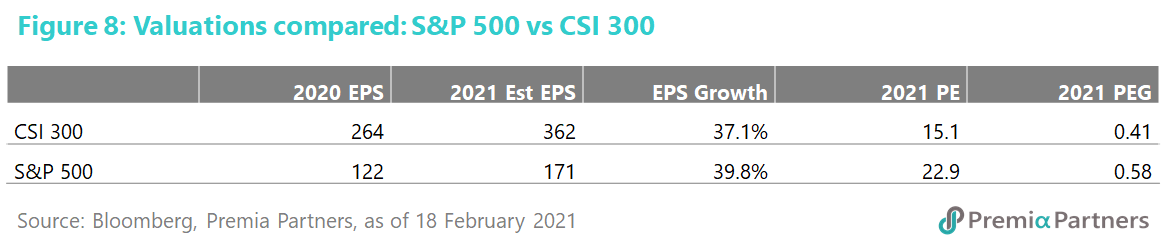
5) Still better value in Chinese equities. The TTM dividend yield for Chinese equities is currently around 2.0%, versus 1.6% average for US stocks. FY21 EPS growth for the CSI 300 is competitive at 37% versus 40% for the S&P 500. The FY21 PE ratio for the CSI 300 is 15.1x, hence delivering a PEG ratio of 0.41. The FY21 PE ratio for the S&P 500 is 22.9, hence translating to a higher PEG ratio of 0.58 (figure 8).
The above factors suggest that, notwithstanding their strong outperformance over the past 12 months, Chinese equities could continue to outperform on that combination of higher economic growth, a strong CNY, less distortion of market signals from central bank interventions, and more attractive valuations.