Last week, we introduced our Asian Innovative Technology strategy, targeting 3 areas of innovation that we believe will define the next 5-10 years. Asian growth and investment returns are increasingly powered by innovation and we have built a way for investors to prioritize companies at the leading edge in their portfolios.
The other way to look at growth is through the lens of population and consumer growth. We all know the China and India stories, but recently we’ve had clients seek growth elsewhere, as a diversification trade and as a hunt for underinvested markets. This led us to the creation of an Emerging ASEAN growth strategy. ASEAN is the only market that compares to China and India in terms of its expected trajectory, yet it’s under-owned by most of the world’s investors. In this post, we’ll focus on why ASEAN should be in your portfolio and on our approach for adding it easily and at low cost.
What is ASEAN and why should you own it?
For those who don’t know, ASEAN stands for Association of Southeast Asian Nations, and is comprised of 10 economies that together make a major economic bloc. The members are Singapore, Indonesia, Malaysia, Thailand, Philippines, Vietnam, Brunei, Laos, Cambodia and Myanmar. The latter 5 are not part of major MSCI indices so most investors have 0 exposure to them. The ones that are part of major indices are there at relatively small weights, with Singapore at ~0.4% of MSCI World and Indonesia, Malaysia, Thailand and Philippines collectively at ~7% of MSCI Emerging Markets. These are the definition of under-owned in our book, which is amazing given the long-term growth story of ASEAN. Here are a few points to illustrate the growth opportunity being missed by many of the world’s investors:
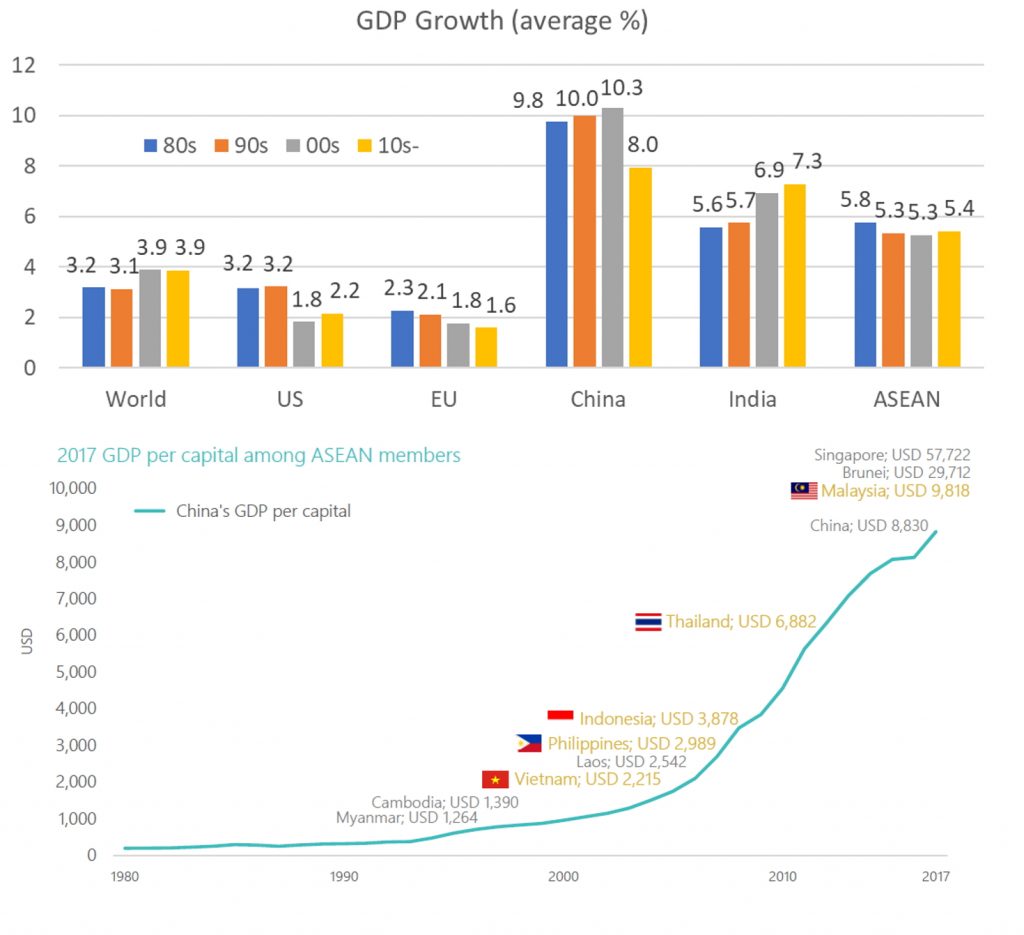
1. A major source of current and future GDP growth: ASEAN collective GDP is growing at a rate of 5-6% and currently totals $2.4 trillion. This isn’t just a high absolute rate – it has been steady for nearly 4 decades and is behind only China and India in terms of driving global economic growth. In fact, as China’s growth rate has slowed, ASEAN has remained remarkably steady, especially since the data is combined from 10 different nations meaning there is limiting “massaging” possible. This high rate of growth is expected to continue going forward due to very low GDPs per Capita through the region. Except for Singapore and Brunei, the other 8 nations are under US$10k GDP per capita. 6 of the 8 are under 5k. To put this into context, much of ASEAN is where China was 10-20 years ago. Talk about a long-term growth opportunity!

Sources: 1st graph- IMF, as of Dec 2017; 2nd graph – The World Bank as of Dec 2017
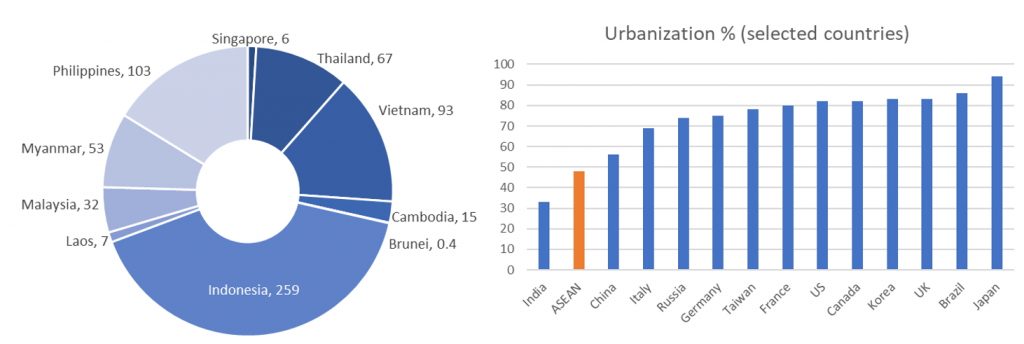
2. Demographics: ASEAN is home to ~700m people, more than the EU. Importantly, the median age is only 28.8, making it one of the youngest regions on the planet. In contrast, China’s median age is 37.3, almost the same as the US at 37.8. To top it off, the region has an urbanization rate of less than 60%, but growing at nearly 6% a year. A young population results in a large and sustainable workforce while urbanization unleashes economic expansion not possible in rural areas. On both counts, ASEAN scores well for the next 5-10 years.

Sources: ASEAN, CIA World Fact Book as of Dec 2017
3. Domestic economic growth: ASEAN has a stigma of being tied to USD debt and US trade, always the first to move down on dollar strength. But interestingly, the story has changed drastically since 1998. Today, 77% of the revenue in ASEAN listed stocks is domestic. Most of the debt is domestic too. In terms of overall trade, nearly 25% is intra-ASEAN trade. China, Japan and rest of APAC make up the bulk of the rest, at ~45%. Trade with the US is less than 10%, making ASEAN less susceptible to trade war dynamics. With the exception of Singapore, most ASEAN stocks are less export oriented than much of the emerging markets universe. Finally, there are currently ~60m ASEAN households with discretionary spending ability, i.e. the consuming class. This is set to double to ~130m by 2025, perhaps the only consumer story outside of China today.

Sources: MSCI, ASEANI as of Dec 2016
Aren’t there already ASEAN products available?
Our count shows 60 ETFs and 80 active funds globally. But as always, we find a lot to be desired. On the active side, there are some interesting products, and a few have great performance. If the investment team sticks around, their high fees are worth it. For the rest, story is simple – high fees, high transaction costs in an illiquid market and high team turnover can lead to less than stellar results. Our proposed methodology would have ranked near the top of the 2nd quartile over the last 5 years, and that’s for a relatively simple beta exposure.
On the ETF front, the average fees are ~0.8% and bid/asks are close to 1%. The highest asset and most liquid ETFs are all in the US, resulting in tax inefficiencies, time zone difficulties and other challenges for global investors. Many of the rest are listed in Thailand, Indonesia, etc. meaning they do not solve access problems. There are only 3 ASEAN-wide beta strategies in existence, averaging 19m in assets, 0.86% in TER and 1.26% in bid/ask spreads. Something we plan to improve on in 1 month.
How does the Premia Dow Jones Emerging ASEAN Titans 100 strategy work?
Our solution is simple – prioritize the growing markets, own the largest and biggest contributors to economic growth, and minimize liquidity challenges in what are otherwise illiquid markets. To do this, we partnered with S&P Dow Jones Indices and worked to customize their Titans methodology. Here’s how it works:
Step 1: Prioritize growing and liquid markets within ASEAN
Exclude Singapore due to its developed market status and slower growth rates
Include Indonesia, Malaysia, Thailand, Philippines and Vietnam
Step 2: Own the top 100 companies in the region
Select stocks on a score of float-adjusted market cap (60%), revenue (20%) and income (20%)
Step 3: Ensure diversification throughout ASEAN to the extent possible
Cap country exposure to 25% and company exposure to 8%
A simple approach that enables broad exposure to one of the fastest growing regions in the world.
If I invest, what do I own?
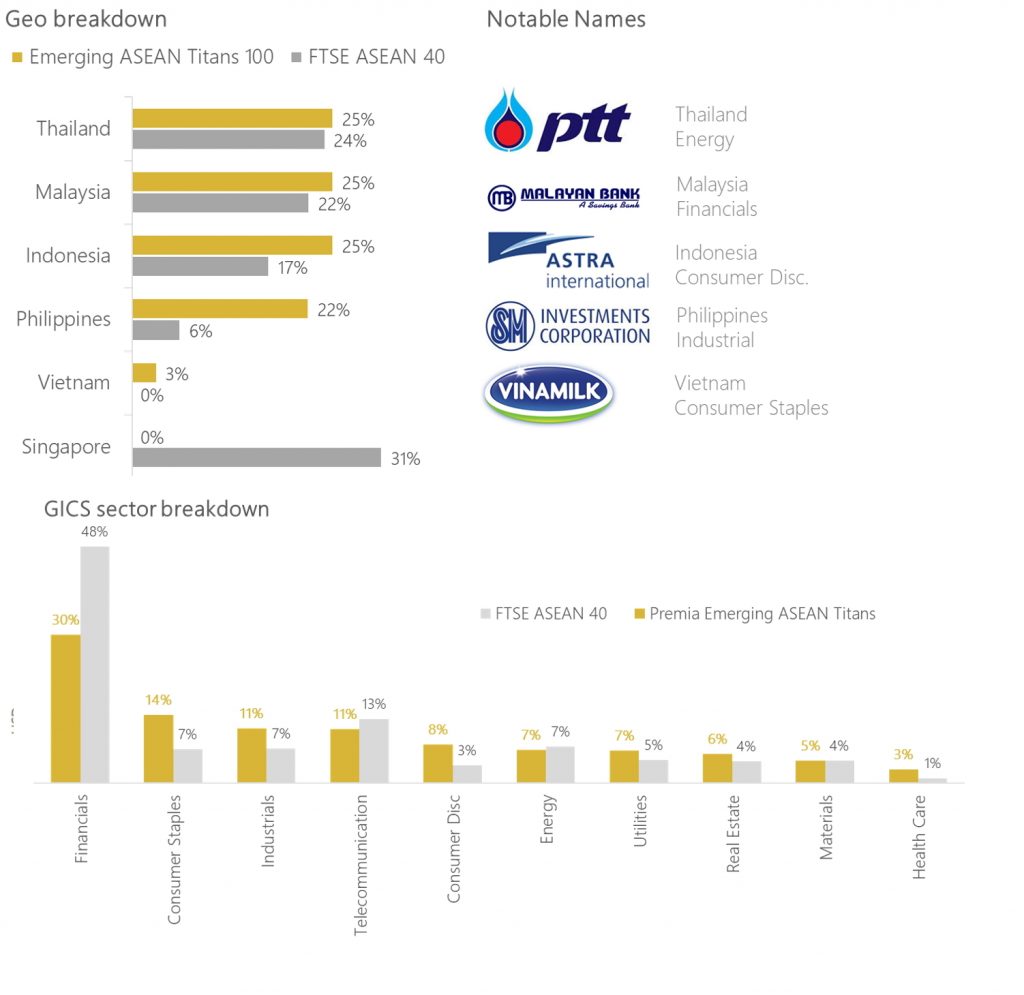
Many investors use the FTSE ASEAN 40 as the default index, which we think is too narrow. Below is a comparison of the Dow Jones Emerging ASEAN Titans 100 Index to that 40-stock universe. First off, Singapore goes from ~30% to 0%, allowing us to prioritize the faster growing markets. A side effect is a drop in financials’ weight from ~50% to ~30%, again allowing a broader sector exposure throughout the region. This is largely because most of the Singaporean exposure in FTSE ASEAN 40 is DBS, OCBC, UOB and SG Telecom., combining for 28% of the total index.

Source: Bloomberg, S&P Dow Jones Indices, FTSE; data as of Feb 2018
How has ASEAN and this strategy performed over the last few years?
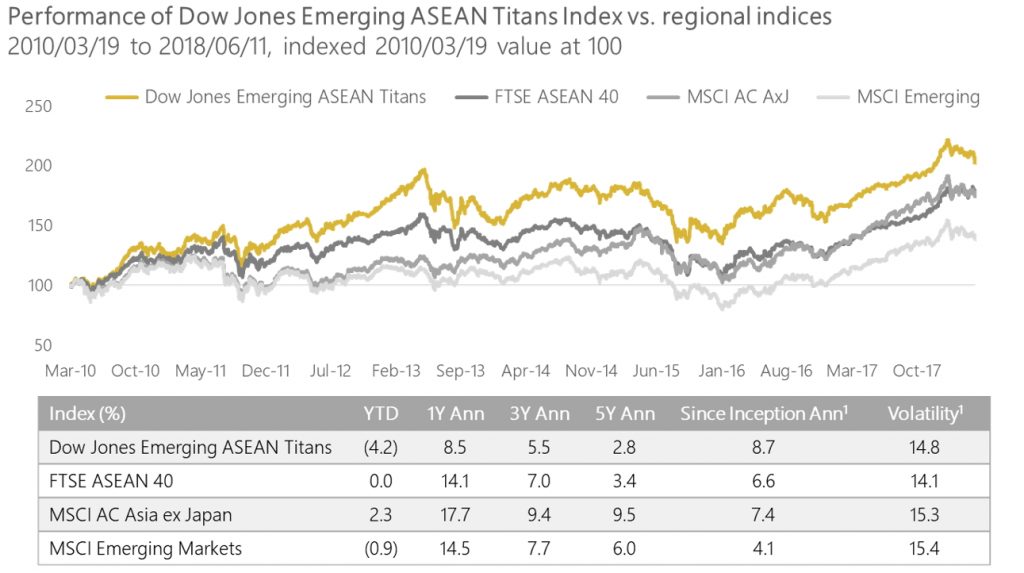
The long-term economic growth story via a broad 5 country exposure shows up in performance too. Below is a chart comparing our strategy’s index vs traditional ASEAN, AxJ and China exposures. Not bad for a region many don’t think twice about. The Titans exposure has outperformed all the above markets over the last 8 years, including the narrower ASEAN exposure with Singapore in it. It is of course not always perfect – the last few years have been less than stellar. That is why we believe there’s an opportunity to invest now, adding an exposure to long-term economic growth at today’s low valuations.

1: Annualized figure from 2010/03/19 to 2018/06/11 Source: Bloomberg, S&P Dow Jones FTSE, MSCI
Past performance is no guarantee of future results, but markets do follow economic growth. ASEAN is a long-term investment opportunity and we believe this exposure allows you to capture it efficiently and with minimal effort. We will bring this strategy to market soon and would love to have a dialogue with all of you in the coming weeks and months about its merits. To ask us a question, or to let us know your interest, click here.

