Investing in extraordinary times calls for an open mind to the extraordinary financial circumstances of the day, even if we don’t like them --- courage and appropriate risk management. The equities rallies of 2020 defied economic fundamentals. What we believe will be further gains in equities in 2021 will again defy fundamentals.
COVID-19 has inflicted enormous damage on the world economy. The IMF estimated the world would lose 4.4% of its economic output this year. That’s around USD 3.9 trillion – or the entire GDP of Germany – lost in one year.
The pandemic will be with the Developed Markets most of next year, and possibly much of 2022 for many Emerging Market economies. After the pandemic, economic growth is likely to be structurally lower than before the pandemic, particularly in the Developed Markets. Governments are more indebted than ever, financial systems possibly at their most fragile since the Second World War.
However, yield starvation – the result of financial repression – will likely drive more of the USD 4.4 trillion last seen sitting in US money market funds into equities. As a comparison, there was a much smaller pool of USD 3.8 trillion sitting in money market funds at the worst point of the Global Financial Crisis.
Then there is fear of inflation amidst financial repression. That is, rising prices – not least asset prices – amidst zero rates for cash. With near zero yields for US Treasuries, the so-called yield gaps around the world continue to favour equities over bonds. We continue to overweight equities over cash and bonds.
Relative performance should rotate in terms of both sectors and geographies. The rotations that started early November – from growth to value and from Developed Markets to Emerging Markets (particularly ASEAN) – should gather pace in 2021.
China will likely continue to benefit from inflows of funds into Emerging Markets. After all, it is almost half the MSCI Emerging Markets Index. Indeed, Chinese equities could get another boost later in 2021 as they evolve from an early pandemic recovery story to a global economic/trade recovery story. We underweight US and European equities, neutral weight Japanese stocks, and overweight Emerging Markets and Asia Pacific ex-Japan, including Chinese equities.
Relief as the world emerges from an induced economic coma. Vaccines have started rolling out. Despite a worsening pandemic in the United States, markets will likely look past that with a sense of relief that vaccines are finally here.
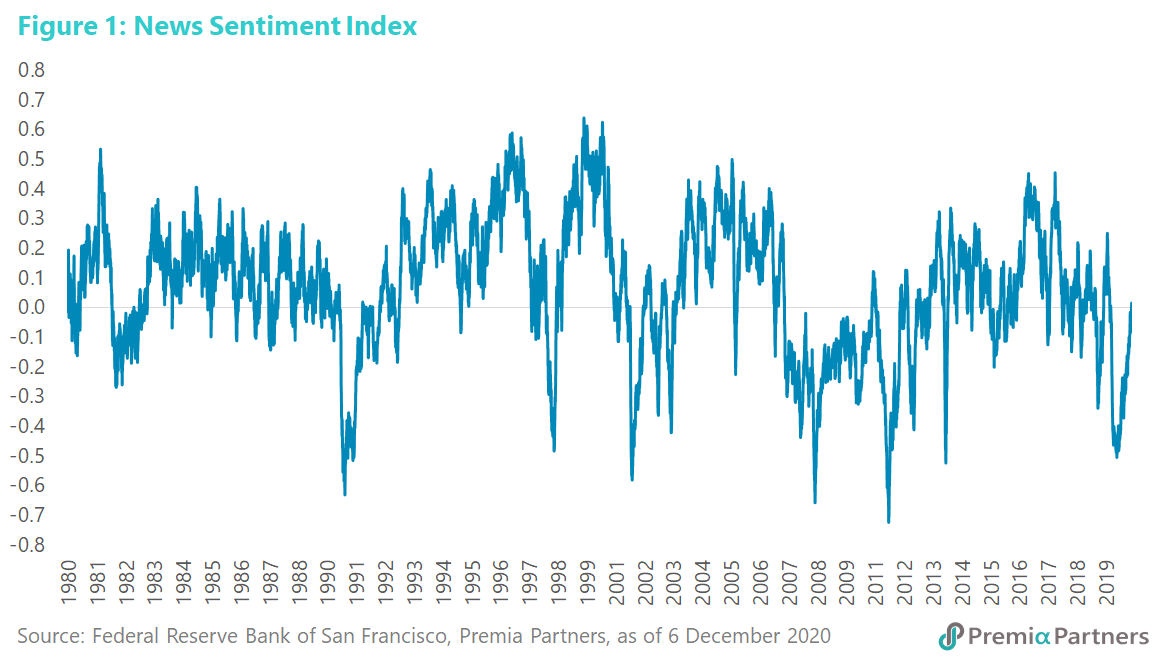
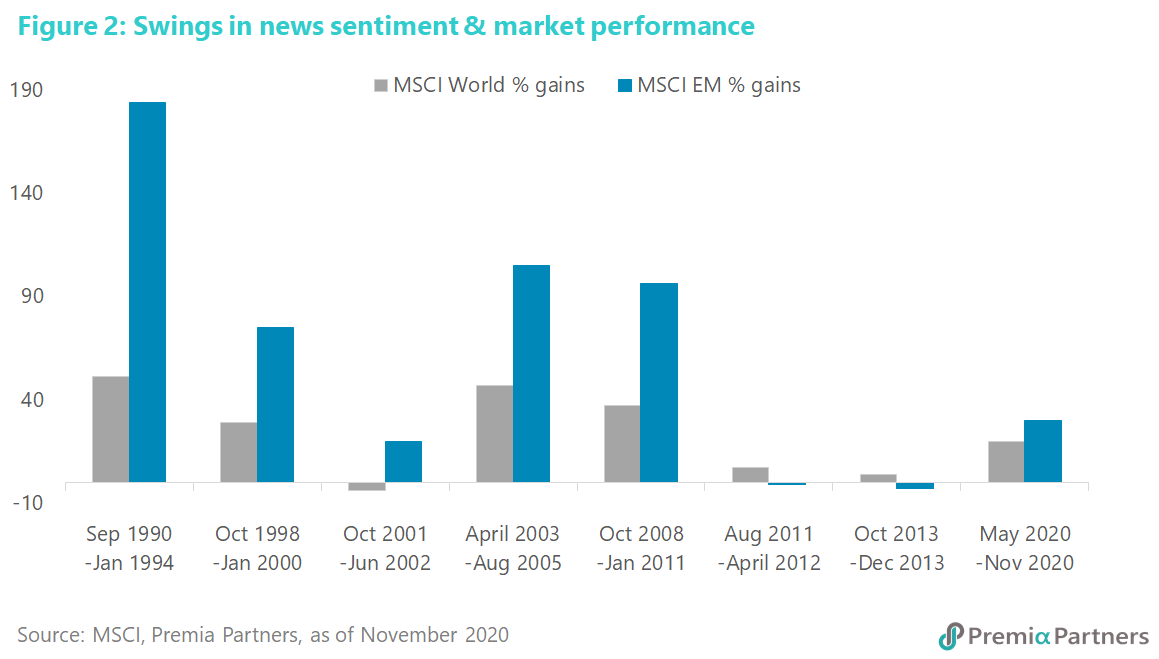
The impact of that sense of relief is demonstrated in the News Sentiment Index published by the Federal Reserve Bank of San Francisco. The Federal Reserve Bank of San Francisco cites methodology from Shapiro, Sudhof, and Wilson, and its index shows that we hit a trough in negativity in the news media in May of 2020 (figure 1). Tracking the major swings in the News Sentiment Index, historically, the bottoms of these new sentiment cycles have typically been good for stock markets, with Emerging Markets tending to produce generally bigger, if more volatile, gains than Developed Markets (figure 2).
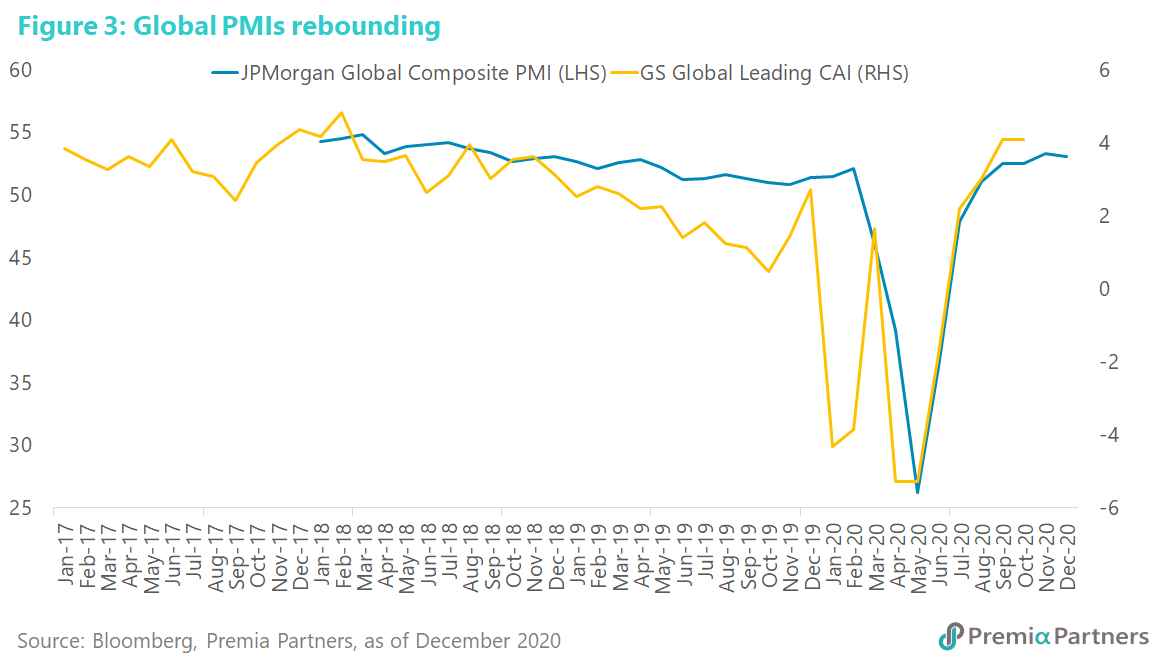
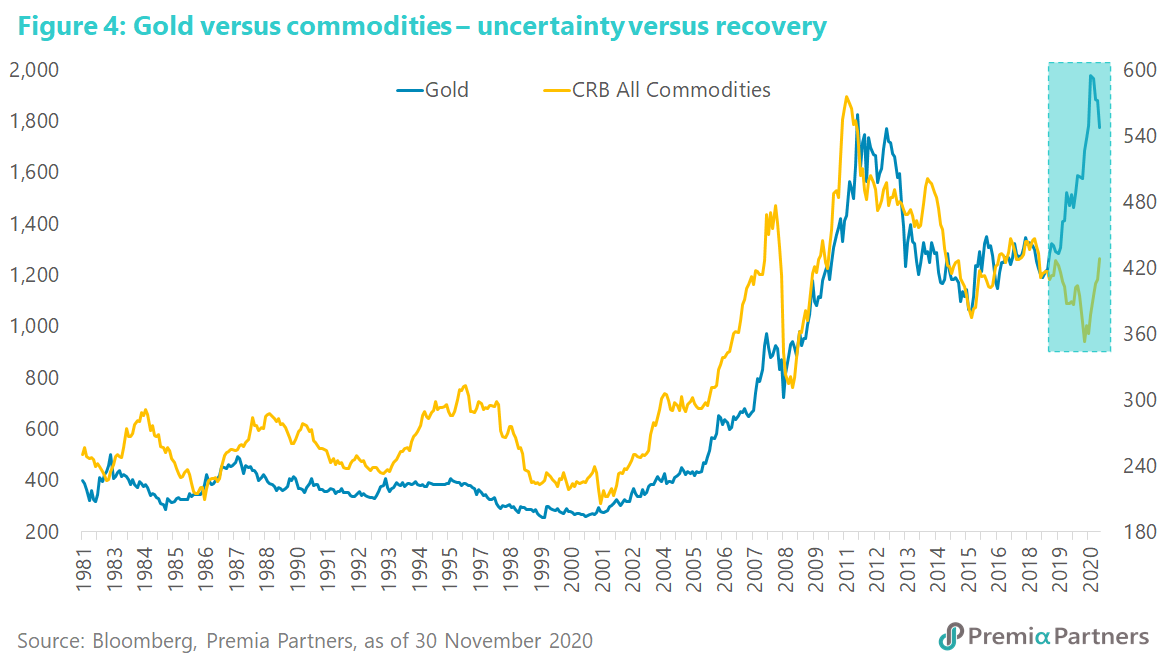
Economic recovery will be given more credibility by vaccines. There has already been a sharp global economic rebound off 2Q20 lows as mirrored in global Purchasing Managers Indices (figure 3). As vaccines roll out, greater business confidence will result in inventory restocking which should drive economic activity yet higher. Already the early stages of the closing of the gap between commodities and gold prices is reflecting the narrowing of the gap between uncertainty (a gold trade) and economic recovery, which is a commodities trade (figure 4).
Fear of inflation with financial repression and grudging participation in risk. The threat of rising inflation amidst bureaucratically repressed interest rates is terrifying for savers – and that includes institutions that act on behalf of savers.
In this scenario, they are faced with erosion of their savings with little or no compensation in cash. They end up subsidising the deficit spending of governments, in a form of wealth transfer.
Swiss Re Institute estimated that US households have sacrificed USD 160 billion per year on average since 2008 from lost interest income on deposits, pensions and life insurance assets as a result of financial repression. This is equivalent to a net tax of about 3.5% on US households' disposable income each year.
Long-term investors such as US and European pension funds and insurers are also losing out, foregoing USD 185 billion of yield income, or about 1.5% of their total fixed income investments, per year on average, estimated Swiss Re Institute.
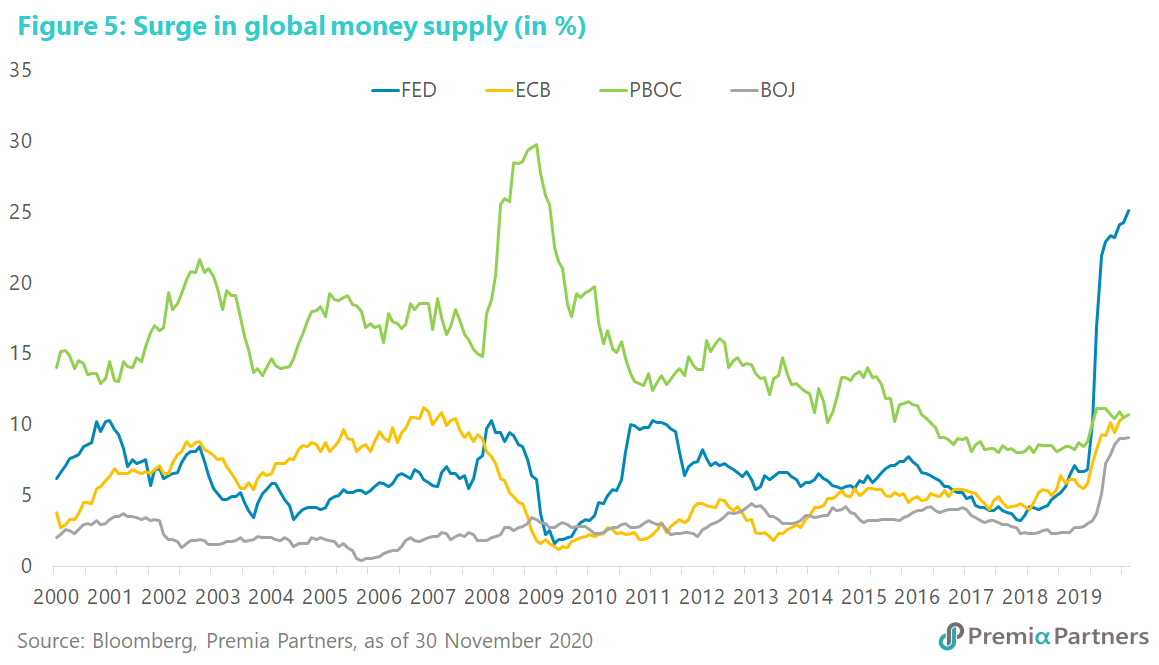
The idea of central banks financing government spending – previously regarded as a dangerous idea from an arcane Modern Monetary Theory – is now reality. At the front of the pack is the US Federal Reserve, which has expanded M2 money supply by 24% from end-February 2020 to end-November 2020. The ECB expanded its M2 money supply by 17% from end-February to end-October; Bank of Japan expanded M2 by 115% from end-February to end-November; and the People’s Bank of China by 113% from end-February to end-November (figure 5).
This would have been a catalyst for asset price gains around the world – both directly (through quantitative easing) and indirectly by forcing cash out of money markets into stock and credit markets out of fear of debasement of fiat currencies. Metaphorically speaking, both Developed Market and Emerging Market stock prices can be seen as mean-reverting around that rising tide of global money supply.
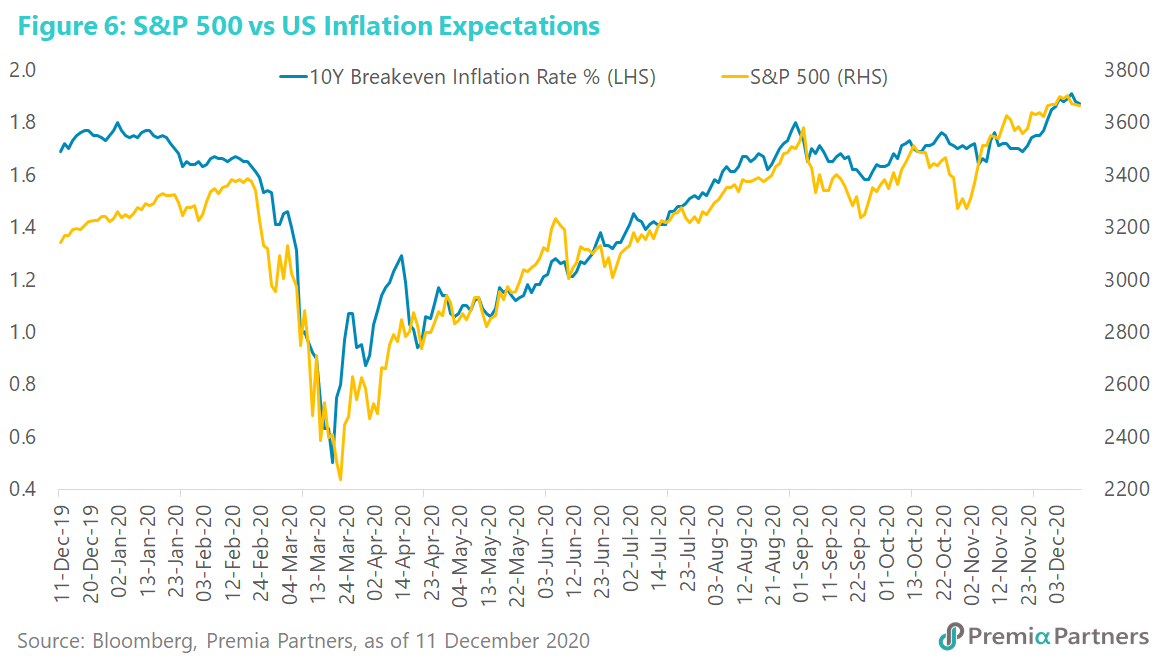
While inflation has yet to emerge as a clear trend, there is already rising fear of inflation as reflected in the US 10-year breakeven inflation rate (figure 6), which is implicit in the nominal 10-year US Treasury yield minus the 10-year US Treasury Inflation Protected Securities’ (TIPS) yield.
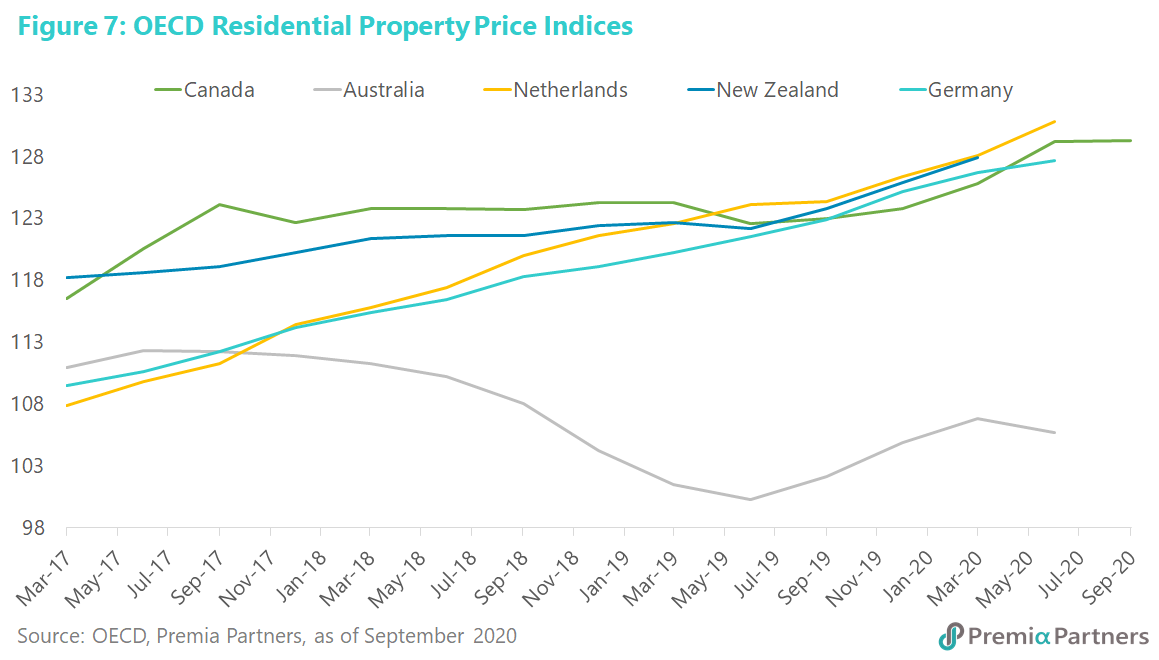
Fear of inflation has also bubbled up in house prices rising throughout the OECD despite the pandemic destroying jobs, incomes, savings and rentals. Note that in the chart below (figure 7), Australia’s data stopped at 2Q20. Prices have risen in all Australian capital cities in more recent months.
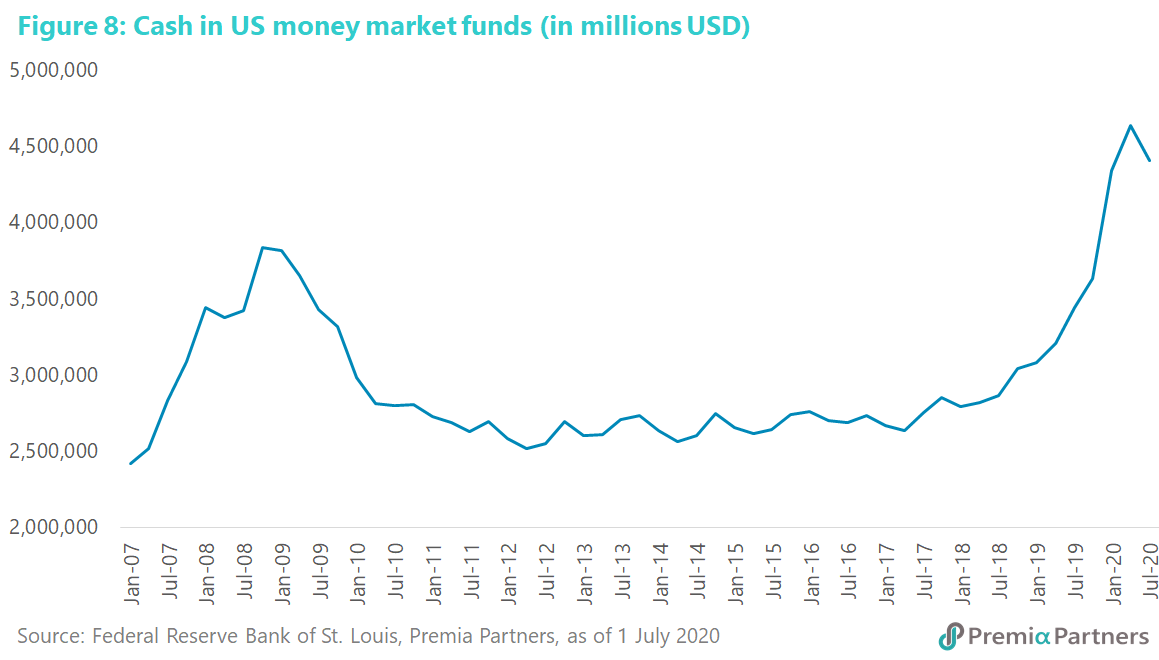
Meanwhile, the amount of cash sitting in money market funds is way higher than even at the worst point of the Global Financial Crisis (figure 8). It peaked in 2Q20 at USD 4.6 trillion and by end-3Q20, it eased only a little bit down to USD 4.4 trillion. During the Global Financial Crisis, this cash pile peaked at USD 3.8 trillion around end-2008 and early-2009. That cash then ran down to USD 2.5 trillion by 2Q12. Note that this cash pile had been building up from 2017, in what was described in those years as “the most hated bull market in history.” In short, cash had been building up in tandem with rises in equities indices, reflecting mistrust and lack of participation in the rally.
Ironically, it took a disastrous pandemic to start bringing funds out of cash. At USD 4.4 trillion, we haven’t yet seen anything of the sort of “breaking of the dam” experienced from 2009 to 2012.
The dash from cash could continue until financial repression ends. The question that had been hanging over the markets for years is “when does this all end?”
If this is indeed driven by fear of inflation and financial repression, rising consumer prices in itself is not necessarily going to derail the rally. It may require inflation of such magnitude as to force policy makers to abandon financial repression.
Remember also that financial repression is widely understood to drive asset inflation, more than consumer price inflation. However, for policy action, it is US core PCE inflation that matters to the Federal Reserve, and that has risen from 1.0% y/y in 2Q20 to 1.4% y/y in 3Q20. It is still far from the 2% average inflation target set by the Federal Reserve.
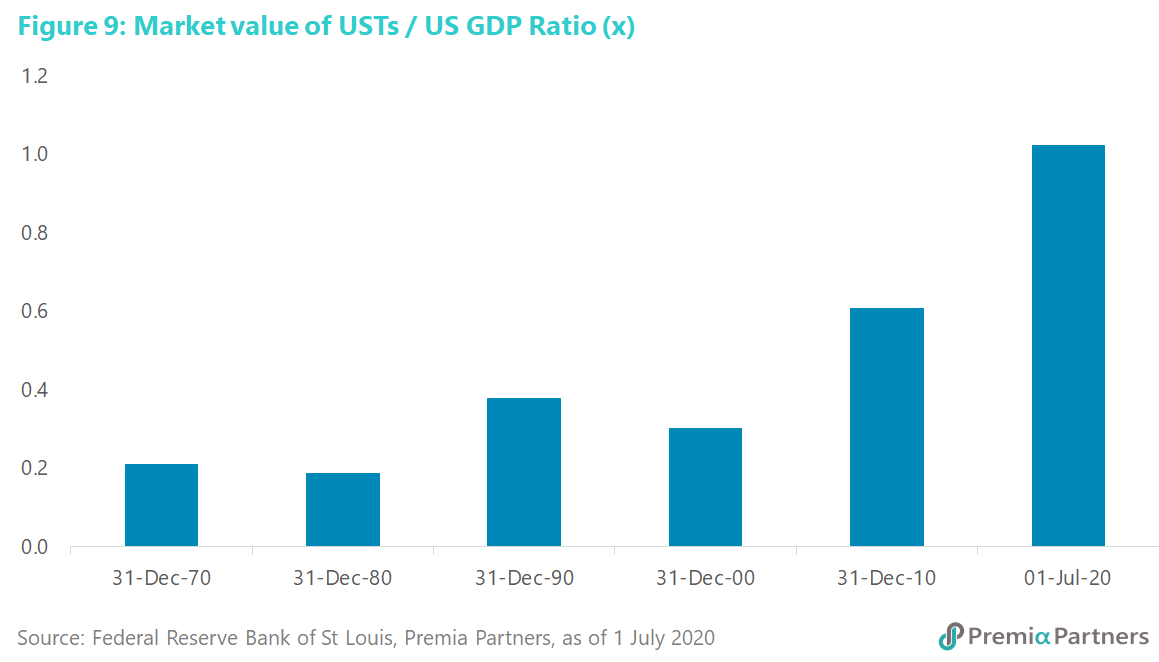
Note that the market value of marketable US Treasury debt stood at around USD 21 trillion at end-October 2020. This has now crossed above 100% of US nominal GDP, compared to only 30% twenty years ago (figure 9). Given the amount of government debt outstanding in the US, Europe and Japan, it will be very difficult for central banks to end financial repression and what has now come to be called in the markets “QE infinity” and “forever stimulus”.
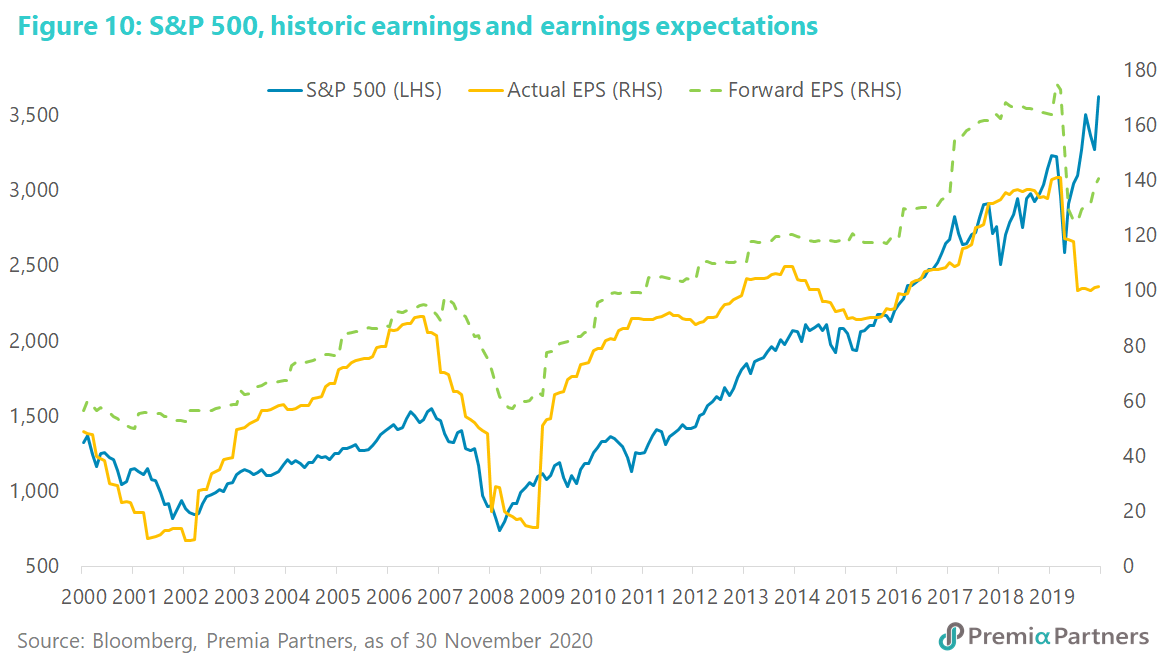
Yield starvation and earnings recovery hopes should deliver tolerance for high valuations. Forward PE ratios are high in most markets by historical standards. The narrative over coming months will be about earnings recovery from the reopening of economies. For example, the PE ratio for the S&P 500 will go from 26x FY20 consensus earnings to 22x on FY21 consensus earnings. Indeed, the market is now looking to 19x FY22 forecast earnings. The earnings catch-up theme will grow in strength over coming months as the vaccination rollout gathers momentum, with upward revisions in earnings expectations (figure 10). Even with higher forecast earnings for FY21, US stocks are still not cheap by historical standards (17x on the 5-year average, 16x on the 10-year average). However, financial circumstances are different today.
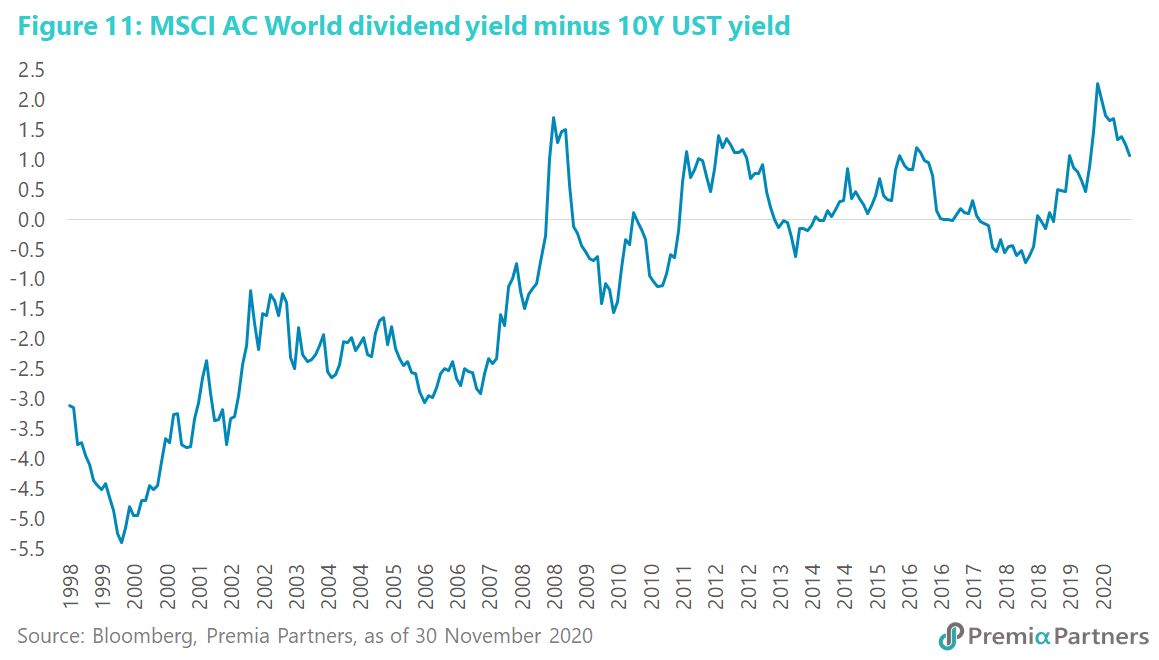
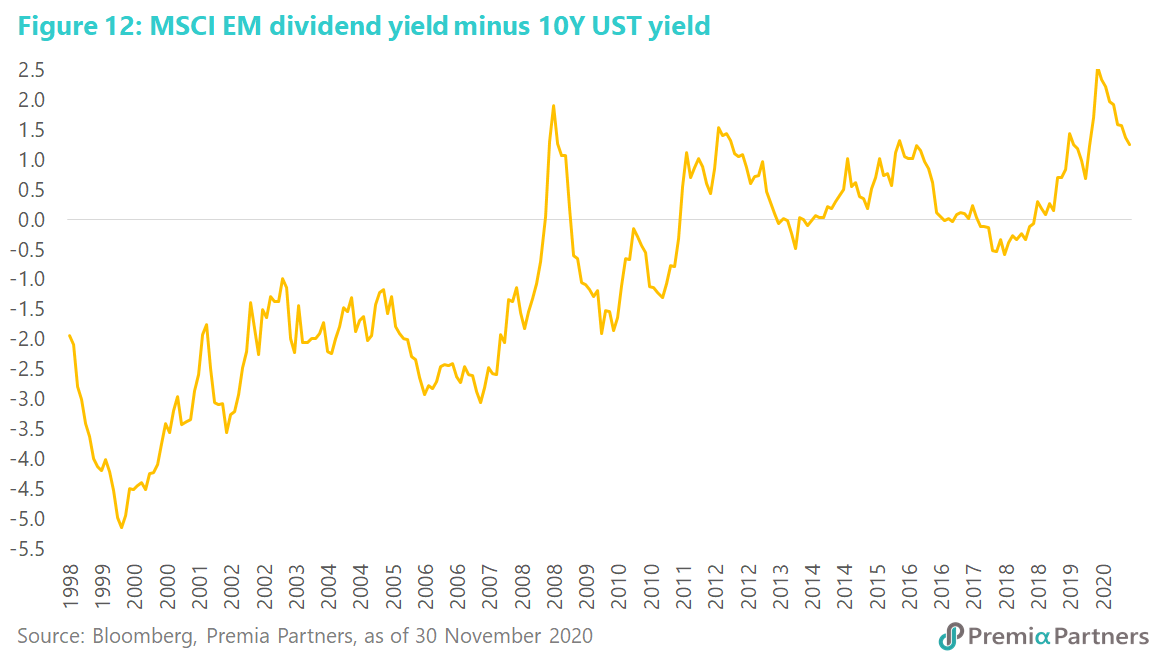
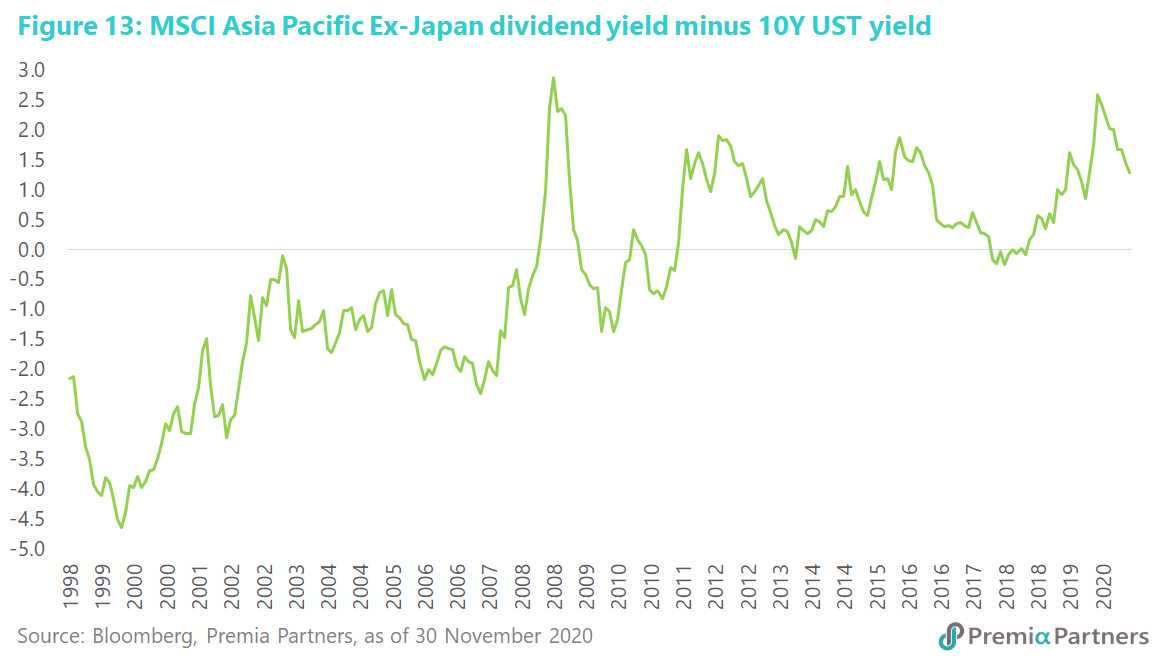
Given the yield starvation caused by financial repression, one indicator to watch would be the spread between equities dividend yields over the 10-year US Treasury yield. That spread is currently still in a healthy positive position, suggesting more funds could continue to be channeled into equities over coming months (figures 11, 12, 13).
Nevertheless, those are only average figures. Risk management would suggest investors switch out of overvalued sectors and markets into laggards with credible earnings recovery prospects.
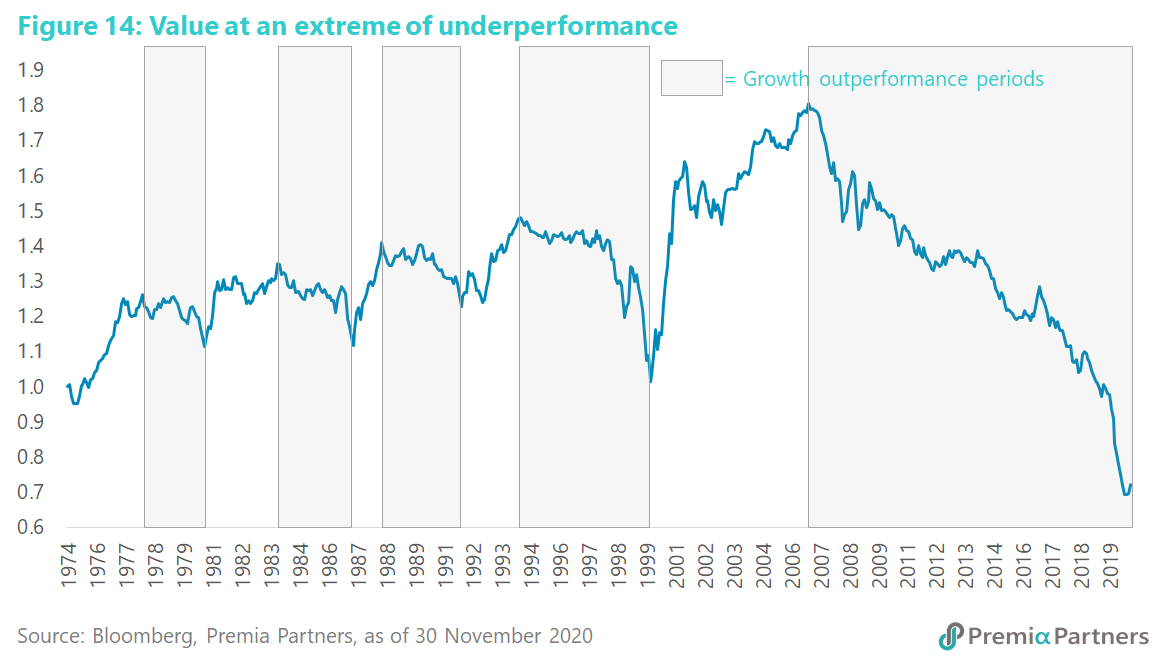
The rotation trade has barely started. The rotation trade – from tech and other beneficiaries of the pandemic to laggards – has only just started. The move from growth to value has just begun. Value has underperformed growth for some 15 years, with the pandemic pushing its underperformance to an extreme (figure 14). Just as the pandemic took the underperformance to an extreme, the reopening from the pandemic could be the trigger for a reversal.
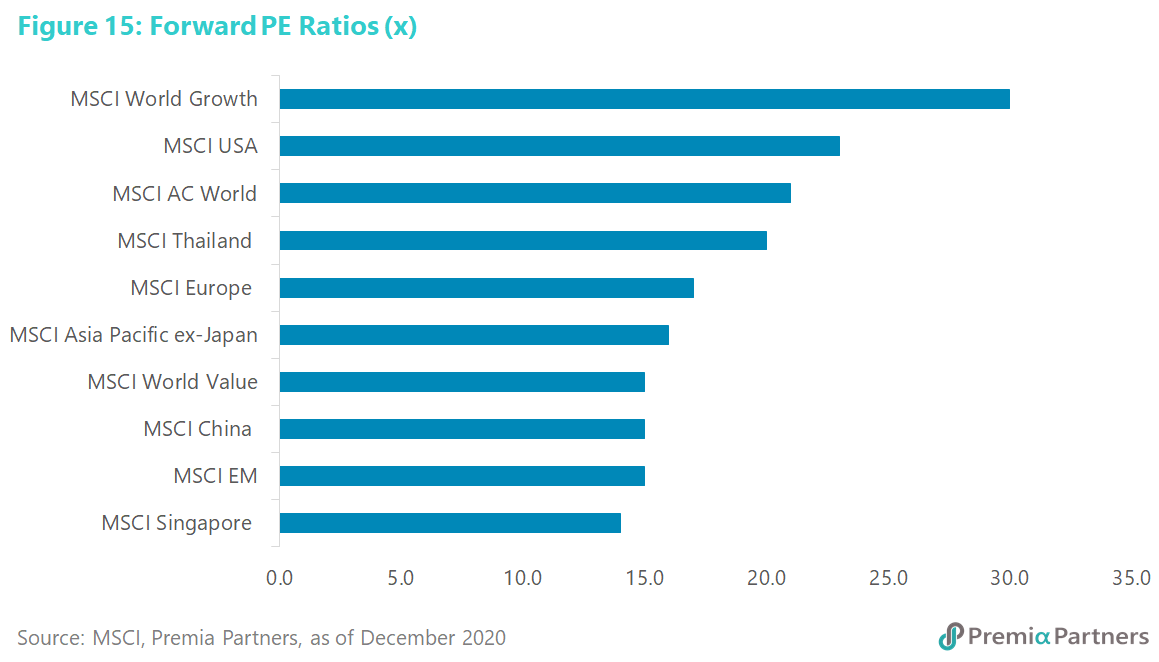
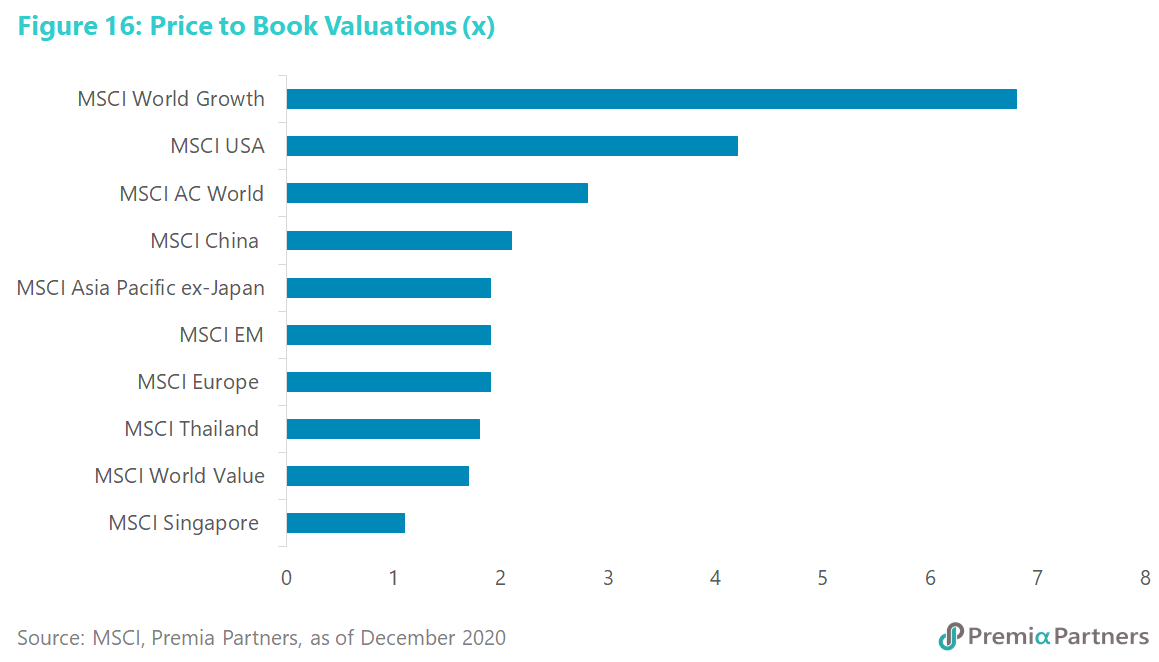
Similarly, there will likely be a rotation into laggard regional and country markets. Emerging Markets and Asia Pacific ex-Japan will likely outperform in coming months on lower valuations (figures 15, 16) and as earnings recovery stories. Singapore stands out as a value play. China, which outperformed from April to October on its status as first in, only one out (of the pandemic), will likely cede outperformance to ASEAN in the earlier part of the coming year, as the vaccine rollout in the region approaches.
Nevertheless, there is more to the China story than just pandemic management. China is in the midst of a historic transformation from an export and investment driven economy to a more balanced growth model driven increasingly by domestic consumption. Meanwhile, exports will climb the value-added ladder. Investments will increasingly be channeled into building productivity gains, developing technological capabilities and in environmental management.
Given the smaller market capitalisation of the ASEAN markets compared to China, the expected portfolio outflows from the United States into Emerging Markets could have a powerful effect on ASEAN stock prices. Yet, China is nearly half of the MSCI Emerging Market Index and will likely continue to be where most of the portfolio flows will go to.
We see two phases in 2021. The first will be driven by pandemic relief. As vaccine rollouts become imminent, those markets which have suffered most economically from the pandemic and consequent activity restrictions could see the strongest relief rallies. Regionally, they would be Malaysia, the Philippines and Indonesia.
The next phase, later in 2021, should focus on the impact of economic recovery on GDP growth, international trade and supply chains. That phase will likely see the return of market attention back to China and those ASEAN economies less affected by the pandemic, such as Thailand and Vietnam. Note also that China will likely go from the only major economy to grow in 2020 to the best performing major economy of 2021.
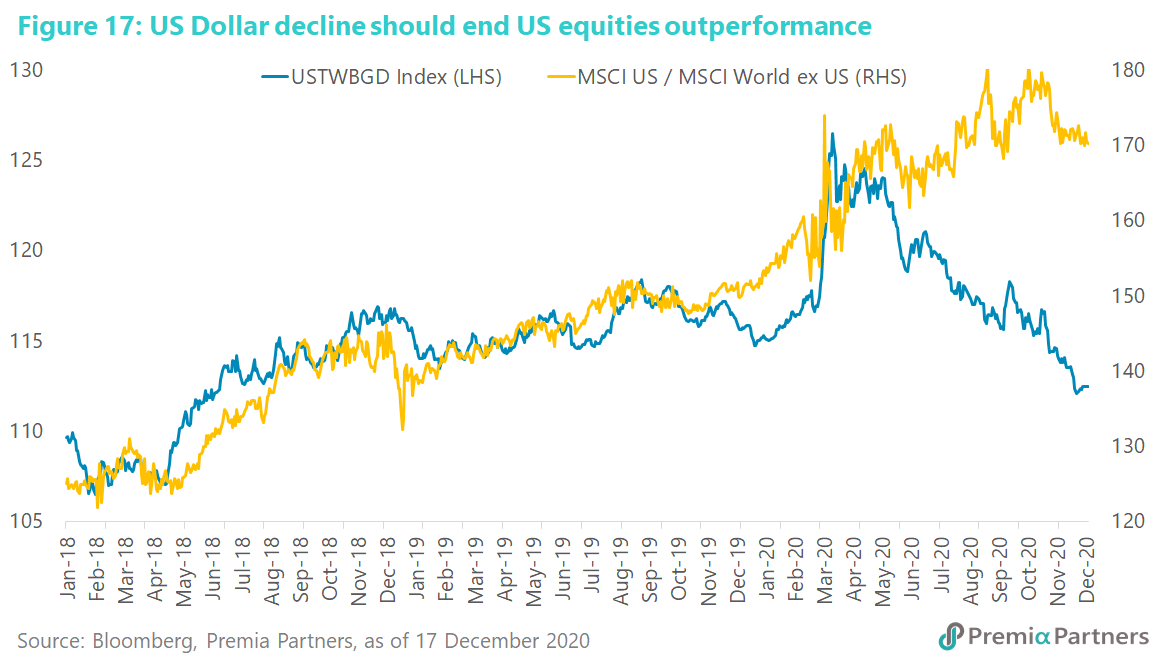
Secular Dollar decline could be another driver for ex-USA equities outperformance, including Emerging Markets. The long cycles of declines in the US Dollar Index have coincided with underperformance of the US market and outperformance by ex-US including Emerging Markets (figure 17). We have been bearish, and continue to be bearish on the US Dollar, given monetary debasement of the Dollar and financial repression in the United States. There will be countertrend rallies in between, but the US Dollar should see further weakness in 2021.
The biggest risks to the equities bull market are earnings disappointment and earlier-than-expected end to financial repression. In the end, valuations will matter. Yet, history suggests that abnormally high levels of policy stimulus is a powerful incentive for investors to tolerate unusually high valuations. This is part of the extraordinary financial circumstances referred to earlier.
The logic of the so-called yield gap as a driver of higher stock prices – and we measure the yield gap by the spread between index dividend yields minus the 10-year US Treasury yield – suggests that the risks are in earnings (more specifically, the consequent cashflow and dividends) and the risk-free rate, for which the 10-year US Treasury yield, or other relevant government bond yield, are the proxies.
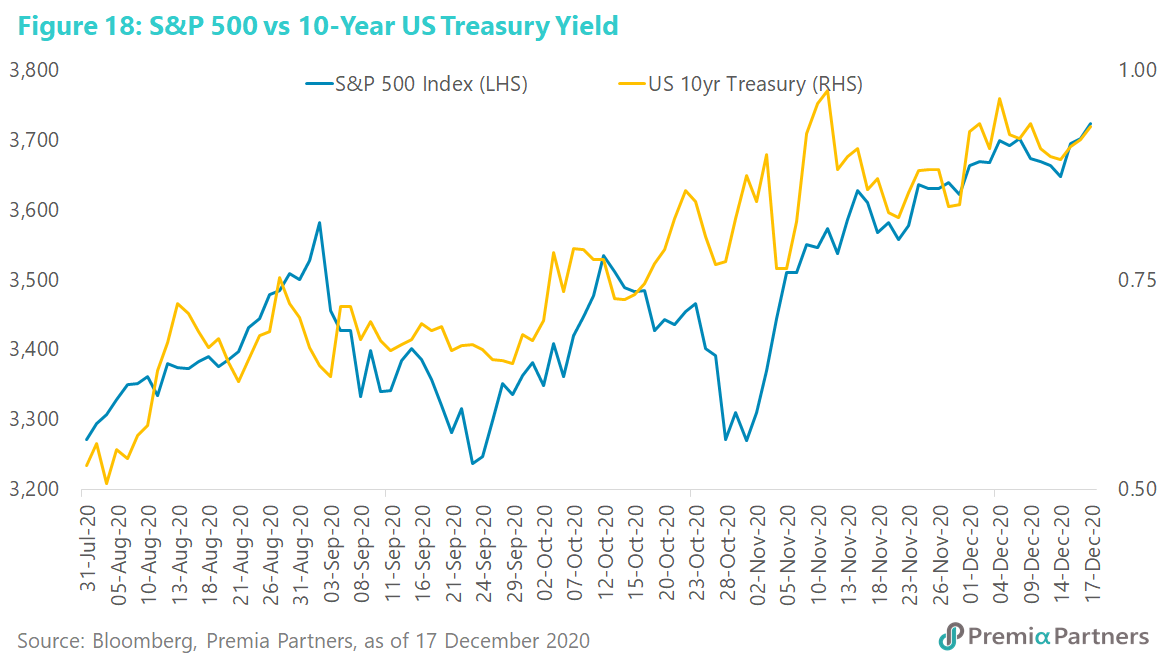
In the early stages of the 2020 rally, decline in the 10-year US Treasury yield encouraged equities higher. By August, when the 10-year yield bottomed at around 0.5%, growing confidence of vaccines and economic reopening drove both the 10-year yield and stock prices up in tandem (figure 18). At around 0.92% at the time of writing, the 10-year yield still provides for a yield gap that is supportive of equities. This is something to watch in coming months.
There is a constant interplay between the risk-free rate and earnings. Growing earnings, cash flow and dividend payments will help offset rises in the risk-free rate.
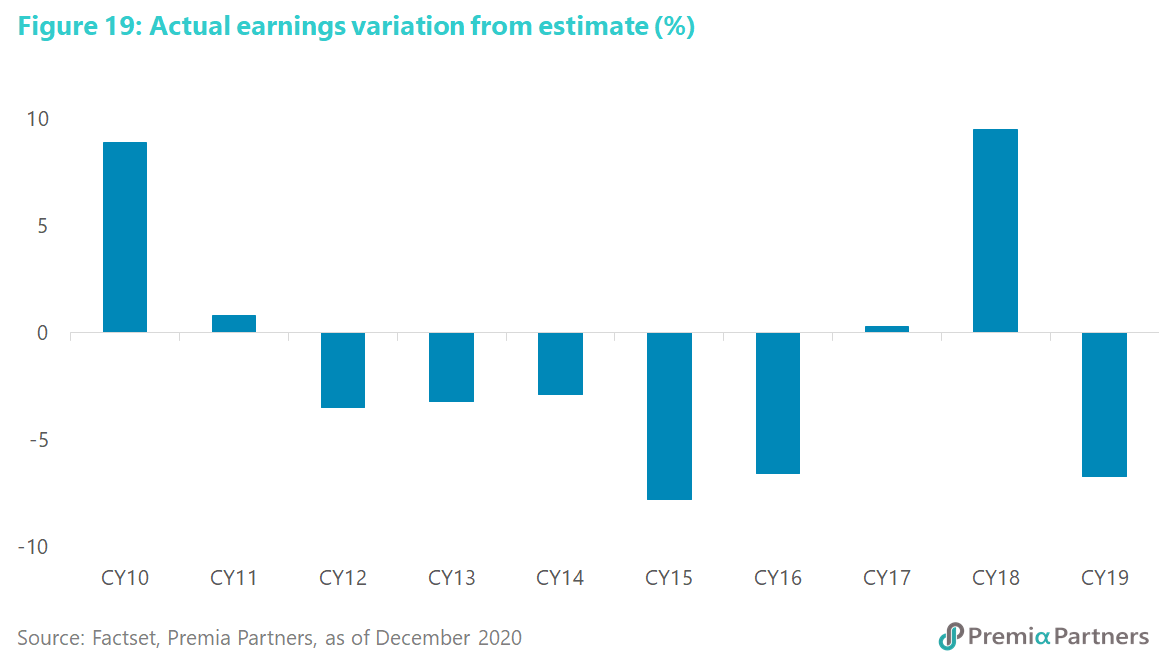
Over the decade to CY2019, there has been a tendency for analysts’ estimates for S&P 500 earnings to be too optimistic relative to actual earnings reported (figure 19). However, if the historical average of 1% over-estimation prevails, it should not make much difference to sentiment. The risk of a dent to sentiment will arise if there is significant earnings over-estimation combined with sharp rises in the 10-year US Treasury yield.