The American dilemma – recession by policy tightening or stagflation by policy avoidance. US GDP growth is running so low now that a recession is a very high probability event within 12 months as rates rise further.
The drivers of that coming recession will be both inflation and higher rates: There can be many different variations of the balance between the pace of rate hikes and the pace of inflation. As US economic growth slows further in coming months, the US Federal Reserve will be tormented over the awful choice between the longer-term impact of inflation and the more immediate risk of recession. Yet in the end, if rate hikes do not crush US economic growth, inflation will eventually do the same, albeit with a greater lag.
In this article, our Senior Advisor Say Boon Lim explains why bounces in US equities are likely to be “get out of jail” cards, with lower lows and lower highs the most likely outcome.
History does not support the market’s still relatively optimistic rates expectations. Market expectations of US rate are still too low, in our estimation, and the Fed is likely encouraging those expectations through its own guidance, with FOMC members’ median view of the appropriate rate peaking at 3.8% by the end of next year, then reverting down to 3.4% in 2024. Given that, it is not surprising the Fed Funds Futures market’s dominant (highest probability pricing) target rate bets are now between 3.50% and 3.75%, at the upper bound, by middle of next year.
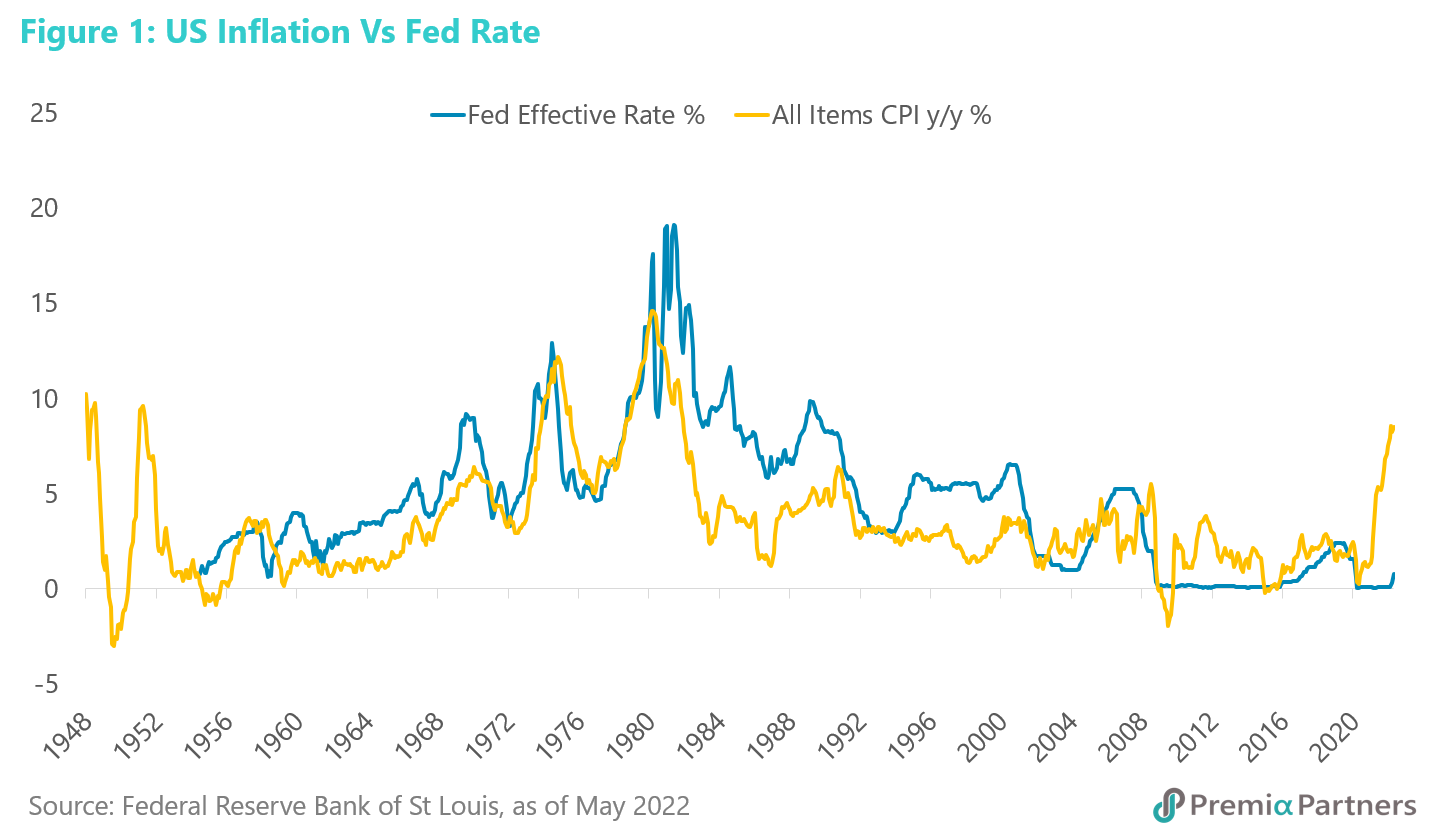
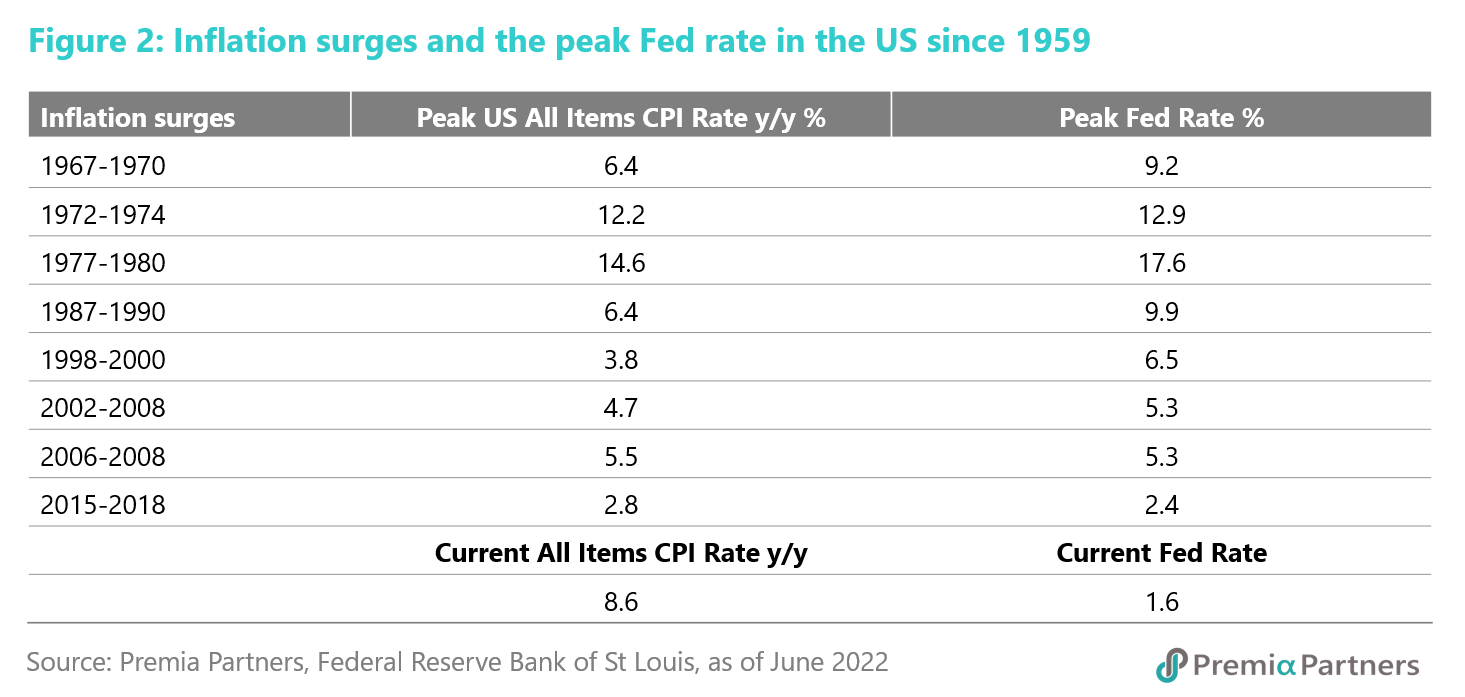
Every US inflation cycle in 63 years has required a peak Fed Rate that either exceeded or came close to the peak inflation rate.We are sceptical of the market’s still relatively benign view of US rates. There has been no precedent since 1959 of uptrends in US inflation reversing without a Fed rate either in excess of that inflation rate, or at least approaching that rate.

This is a summary of the various inflationary surges in the US since 1959, and how the peak Fed rate compared against the peak headline inflation rate. Note that the 2002-2005 and 2006-2008 inflationary episodes could also be seen as one single cycle, with a short-lived decline in inflation, before another flare up. If we were to see it as one cycle, the peak inflation rate would have been 5.5%, requiring a peak Fed rate of 5.3% for one whole year (figure 2). Note also that the very mild inflationary episode from 2015 to 2018 required a Fed Rate only 40 basis points beneath the peak inflation rate. We are currently running a headline inflation rate of 700 basis points in excess of the Fed rate.

The little reported bombshell in Jerome Powell’s recent testimony to the US Senate Banking Committee. A part of his testimony, which was not well covered in the media, was Mr. Powell’s response to U.S. Senator Thom Tillis’ question about the current Fed Rate compared to the various versions of the Taylor Rule rate which Senator Tillis quoted from the Fed’s own semi-annual report as being “over 6%”. The response was so stunning that we reviewed the video of the testimony to understand the context of his comments and hear verbatim what he said.
Seriously Mr. Powell – rates at “pretty close”’ to 6% by year-end? Asked about the prescribed rates called for by various versions of the Taylor Rule, Mr. Powell conceded the rules “did call of course for rates to move up and rates now really are moving up much closer to where the various forms of the Taylor Rule are, and I think by the end of the year, we will be pretty close to where some of the Taylor Rule iterations are.”
The Taylor Rule is a model formulated by economist John Taylor to prescribe the appropriate policy rates under different economic circumstances (including the output gap, the actual inflation rate, the target inflation rate, and the assumption on the neutral rate). The outcomes will be different, given varying sets of assumptions. But it is worth noting the outcomes of a few credible sets of assumptions: The Atlanta Federal Reserve has a Taylor Rule Utility, with three different methodologies, and the outcomes for the appropriate policy rate range from 5.6% to 7.2%. There are more extreme outcomes modelled elsewhere. But for now, let’s settle for something around 6%, which is where the Fed’s recent (June 17) Monetary Policy Report indicated it should be.
If Chairman Powell meant to refer to the Fed rate, it would be catastrophic. So, if we read his reported comments literally, Mr. Powell is suggesting the Effective Fed Rate could rise from 1.6% currently to 6.0% in six months. That’s 440 basis points with only four more FOMCs before the end of the year. That would be “thermonuclear bad” for stocks, government bonds and corporate credits. So, we search for alternative meanings for what he said.
Even if he used the term “rates” more loosely to refer to “yields” at the longer end of the curve, that would still be traumatic for financial markets. We do note that Mr. Powell, in an answer to a later question, pointed to how signalling by the Fed had already resulted in financial tightening, “when you look at the rate curve, well ahead of Fed “actually raising rates.”
Yet, even if Mr. Powell did not mean his comment to be taken literally – possibly citing tightening financial conditions as having done a lot of the heavy lifting – what would that mean for other rates and yields? If he was thinking about the 10Y UST yield, that is now at 3.13%. Should it rise to 6.0%, it would still be catastrophic for the markets.
“Get out of jail” cards and the likelihood of a series of lower lows for US equities. Surveying the overall US economic and investment landscape, our sense is that bounces in the US market may be what is called in the Monopoly boardgame “get out of jail cards” for investors caught long and wrong US equities. That is, there will be bounces but each one could be off a lower low and terminate at a lower high.
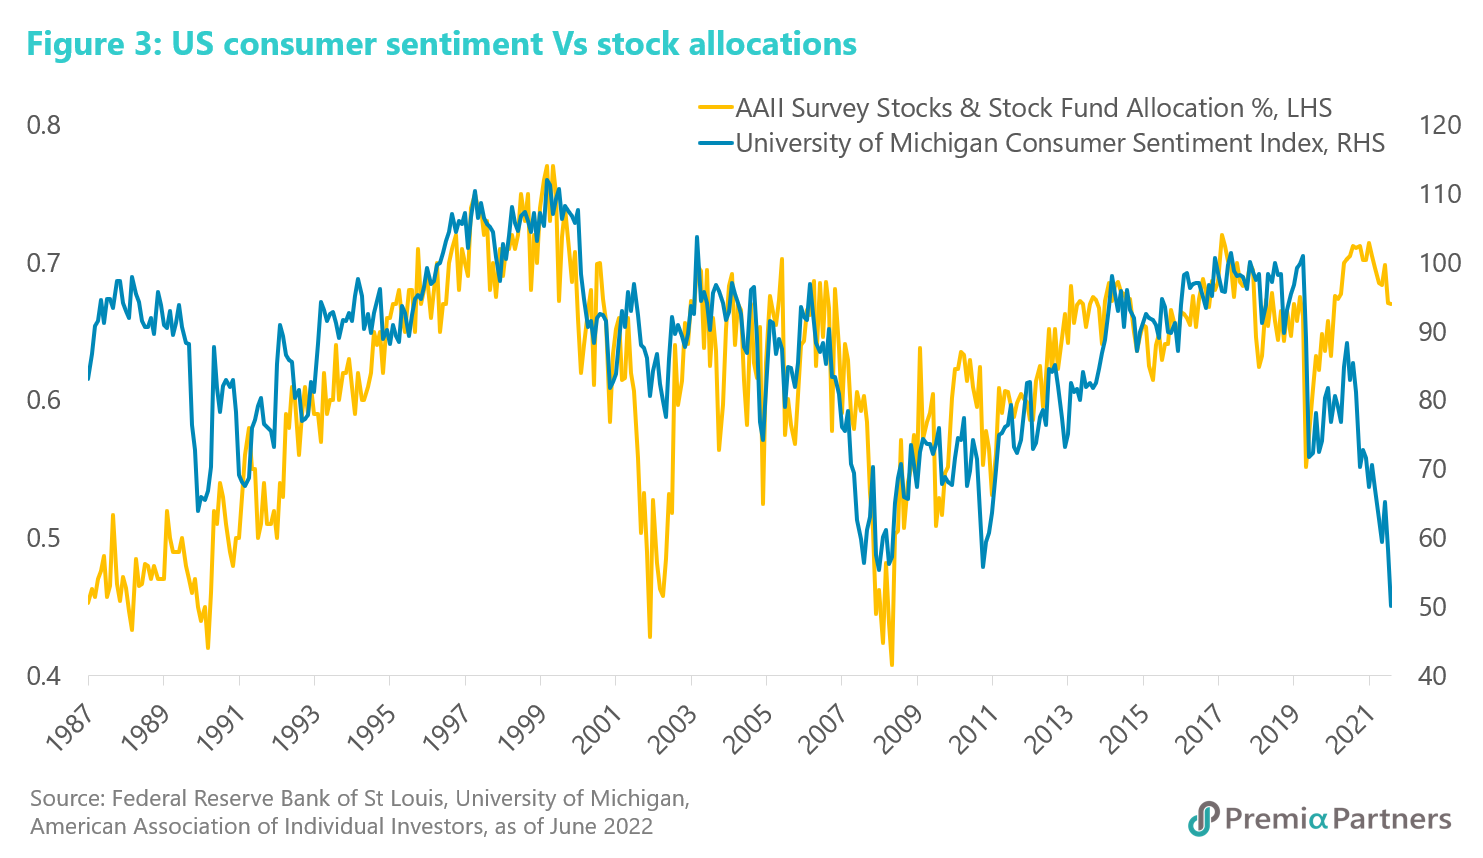
Even as inflation continues to weigh on sentiment, the market will likely find itself buffeted by the rising risk of recession. The University of Michigan has revised its June Consumer Sentiment Index to a final reading of 50.0, down from its preliminary figure of 50.2. This compares to 58.4 for May. This is the lowest recorded for this index and is at levels which previously signaled an ongoing recession. Note there is a historical relationship between the University of Michigan Consumer Sentiment Index and US asset allocations into stocks. The huge divergence between the two currently speak of the risk of more selling ahead unless consumer sentiment picks up quite dramatically.

While we don’t think a recession is underway yet, the risk of a recession is very high. The buffers have run thin: Pandemic savings relative to retail sales have almost normalized back to pre-pandemic levels. Amounts owed on credit cards and revolving credit have soared above pre-pandemic highs. The latest data for m/m growth in real retail sales have gone negative again. Restaurant spending growth has dipped again, albeit hanging in there with a marginal m/m growth rate.
Bottomline: The consensus is still too optimistic on US economic growth. The latest Philadelphia Fed survey of professional economists still had a growth rate of 2.3% for 2Q22, after revising down from 4.2%. We believe 2Q will at best narrowly dodge contraction again on a tiny growth figure with a zero in front of it. Interestingly, the Atlanta Fed’s GDPNow Model, which predicted 2.3% growth for 2Q22 in May, is now estimating zero growth.
Will inventory destocking save the day? There is a growing argument that inventory destocking could ease inflationary pressures, and give the Fed cause to pull back on rate hikes. It is true that inventories – which had grown (on a year-on-year basis) relentlessly over the past 24 months – have shown early signs of coming down, albeit on a month-on-month basis, and there is logic in the argument that inventory clearance often involves price discounting. However, the relationship between US inventory destocking and inflation is not a neat one. While there has been a tendency for destocking to lower inflation, it doesn’t always work that way. When it does, there have been time lags, sometimes up to 6-9 months, before inflation finally turns.
But here’s the catch: Inventory destocking typically also ushers in a recession. So, by the time inflation turns, the US would probably already be in a recession. That takes us right back to the point we started with – about US rates and the coming recession.

