
This is an economy that had already been running too hot – that is, at a positive output gap, or put simply, above sustainable potential capacity – for years. The double shocks of the Trump tariffs of 2025 and now the Iran War will exacerbate the inflation already working its way through the supply chain.
4% inflation is a serious possibility by the end of this year – just on the lagged impact of higher tariffs. But with the impact of oil-driven inflation estimated at between 0.2 to 0.4 percentage points for each 10% rise in the price of crude oil, the inflation damage could be significantly worse. West Texas Intermediate at US$104 a barrel is over 80% higher than where it was at the start of the year, and UAE’s exit from OPEC will have no impact on the price of oil while the Strait of Hormuz is closed. The supply constraint currently is not about OPEC output ceilings but maritime blockades. Any number of scenarios can be constructed on different assumptions of the average price of oil for the year, but unless there is a sudden stop to the War, it is reasonable to expect inflation to be much, much higher than last year.
In theory, even with 4.0% inflation and a real return of around 2.0% (as indicated by the TIPS yield), the 10-year UST yield would be unspeakably high. We are not saying that is where it will be by year end because it is not where the inflation rate is at that matters for the market, but where it is expected to head towards. But that is the upside risk, particularly when you consider the “radical uncertainty” (to quote former Bank of England Governor Mervyn King) introduced by President Trump’s erratic policy and negotiating style.
There are many moving parts, and the most important of these is the duration of the War. That will affect both the inflation rate and the real return demanded by the market. The longer the War, the higher the inflation, and the higher the projections of US government debt and deficits – and by extension the higher the term premium and the expected real return.
The Fed under Kevin Warsh is unlikely to deliver a different outcome. The tail will wag the dog – the market will prevail over the Fed. If the new Fed Chair ignores the market, there is a historical precedent that speaks to what happens when the Fed cuts rates amidst an exogenous shock. In the 1970s – in another war (the Yom Kippur War) but in the same region, with the same commodity – Fed rate cuts amidst an external price shock delivered wild inflation and two US recessions. The US government can wish whatever it likes. The market will do what it wants.
Meanwhile, the equities market’s rally has already lowered the S&P 500’s equities risk premium below that on February 27. The concerns which caused a correction before the War are still there – that is, the capex cost of AI and its business case; China’s low cost/high performance AI models; AI destruction of business models in industries such as software, stock brokerages, business consultancies and wealth management; the rush for the exits in US private credit. Yet, they have been brushed aside in periodic bouts of unfulfilled hopes for an early end to the War, fueled by President Trump’s random and frequent comments. The economy cannot sustain this market – diversify to reduce exposure to the US.
4.0%-5.0% US inflation. The latest IMF forecast of 3.2% inflation for the US for 2026 is an annual percentage change figure – a whole year average – and not an end of period forecast. The latest y/y US CPI datapoint, for March, was already 3.3%, and the IMF’s annual forecast was based on what already looks like an unrealistically low assumption for the price of oil. It was based on an average price of oil of US$82 per barrel. Brent Crude is, at the time of writing, at US$113 and WTI is at US$104. The IMF forecast was published in early April and was based on events and data up until March.
The US-based Peterson Institute for International Economics (PIIE) forecast in January that US inflation could exceed 4% by the end of this year, and that was of course before the War. PIIE said the “core drivers” of its forecast were “the lagged effects of tariffs, an expansion in the fiscal deficit (which could exceed 7 percent of GDP this year), a tighter labor market reflecting the effects of the shift in immigration policy, monetary policy that is looser than commonly appreciated, and inflationary expectations that are drifting upwards.”
In early January, Brent Crude was trading at around US$60/barrel. The impact of higher oil prices on inflation depends on which analysis one refers to. Barclays reckons a 10% sustained increase in crude oil prices typically adds approximately 0.2 percentage points to headline inflation in advanced economies, such as the US. Goldman estimates it is around 0.28 percentage points and the IMF think it is 0.40 percentage points. This is not an exact science but it tells you the situation we find ourselves – where Brent Crude is now 85% higher than where it was at the start of the year – is dire.
Higher oil prices and the possibility of prolonged low intensity conflicts. With the breakdown of talks between the US and Iran, and still no clear endgame in sight, the price of crude oil has resumed upwards. Forecasts are now fraught, but the risk is biased towards (to use that phrase again) higher for longer as the possibility of prolonged low intensity conflict increases. Meanwhile given continued blockade of the Strait of Hormuz, UAE’s exit from OPEC has no practical implications for the price of crude, as it currently exports less than half of what it produces. Both Saudi Arabia and UAE can bypass the Strait of Hormuz. Saudi Arabia can send oil through the East-West Pipeline to the Port of Yanbu and then out via the Red Sea. A recent estimate suggests that Saudi Arabian oil exports have recovered to around 60% of pre-War levels. However, UAE crude cannot access the Red Sea like Saudi Arabia. It can send oil via a pipeline from Habshan to the port of Fujairah, which is just outside the entrance to Hormuz. That has only enabled UAE to bring exports to less than half (estimates range from 40%-48%) its production. Given its proximity to Iran, Fujairah is vulnerable to attacks. Indeed, on May 4, Fujairah was hit by Iranian drones. Meanwhile, numerous mainstream media outlets have recently reported that Iran has released a new map outlining areas in the Strait of Hormuz that it says is under its control – that map had a line drawn across the Gulf, just beyond, to the east of, Fujairah.
Why the US cannot escape world oil inflation. Notwithstanding President Trump’s breezy claims that the US is doing just fine because the US has “all the oil it needs”, it is tied to the international energy markets, including for oil. The US is also experiencing spiralling oil price inflation because it is oil export dependent. The US has been exporting oil since President Obama repealed in 2015 a 40-year ban on crude oil exports. The Trump Administration can try to reinstate that ban, but that would require legislation. It faces three hurdles. The first is political (not least, opposition from the Oil Lobby), the second is financial/economic (big loss of income for the oil majors and loss of jobs from the industry), and the third is production and storage. That is, the US would find itself running out of storage and having to shut-in oil wells, at huge costs, causing long-term damage to oil reservoirs, well bores, equipment, pipelines and storage tanks.
4.0% inflation would pose a threat to US government debt sustainability. At 4% inflation, the 10-year UST yield could be somewhere in the region of 6%, which would be above the US nominal GDP growth rate and hence, government debt sustainability. The 10-year TIPS yield, a proxy for the real return expectation, is around 2% at the time of writing. That suggests a 10Y UST yield of 6%, and that is ignoring the nominal term premium, since the TIPS yield only embeds the real term premium. The US nominal GDP growth rate was running at 5.4% at the end of last year. That is also about the average over the past 10 years. Of course, the assumption here is that the market expectation of inflation equals the latest inflation data point. So, if the market decides 4% inflation will not sustain and expects, for example, 2% inflation, the market outcome for the UST yield will be lower. But then again, the market’s expectation can swing both ways. That is, it can be even higher than the latest inflation data point. In particular, in 1971-1972 and again in 1974-1975 – around the time of the Yom Kippur War – the 10Y UST yield rose while US CPI inflation was falling, because the market looked at the coming inflation shock from the Middle East War. It looked past the prevailing inflation rate and expected much higher.
A long war with Iran will likely exacerbate US government debt sustainability with a dangerous feedback loop for UST yields. The surge in the 10-year UST yield coinciding with the start of the War on February 28 is contrary to the Treasury Bond’s “safe haven” status. On February 27, the 10-year yield ended at 3.97%. It is now 4.42%. One explanation is inflationary expectations. The other is US government debt sustainability. The two explanations need not be mutually exclusive – indeed, they are intertwined. The American Enterprise Institute, a right-leaning, conservative think tank, recently warned of the implications of the War for US interest rates. The US went into this war “with an unsustainable public finance position”, with public debt to GDP likely to exceed its level at the end of World War 2 by 2030, even before taking into account increased defence spending caused by the war on Iran, it said.
Soon after the start of the War, the Trump Administration proposed boosting the US Defence Budget to US$1.5 trillion a year, up from US$1.0 trillion a year. Using the latest Congressional Budget Office’s projections for defence discretionary spending – which accounts for inflation – along with actual appropriated defence spending for FY 2026, the US Committee for a Responsible Federal Budget estimates that increasing the defence budget to US$1.5 trillion would raise total defence discretionary spending by US$5.8 trillion from FY2027 through 2036 and add US$6.9 trillion to the national debt when accounting for increased interest costs.
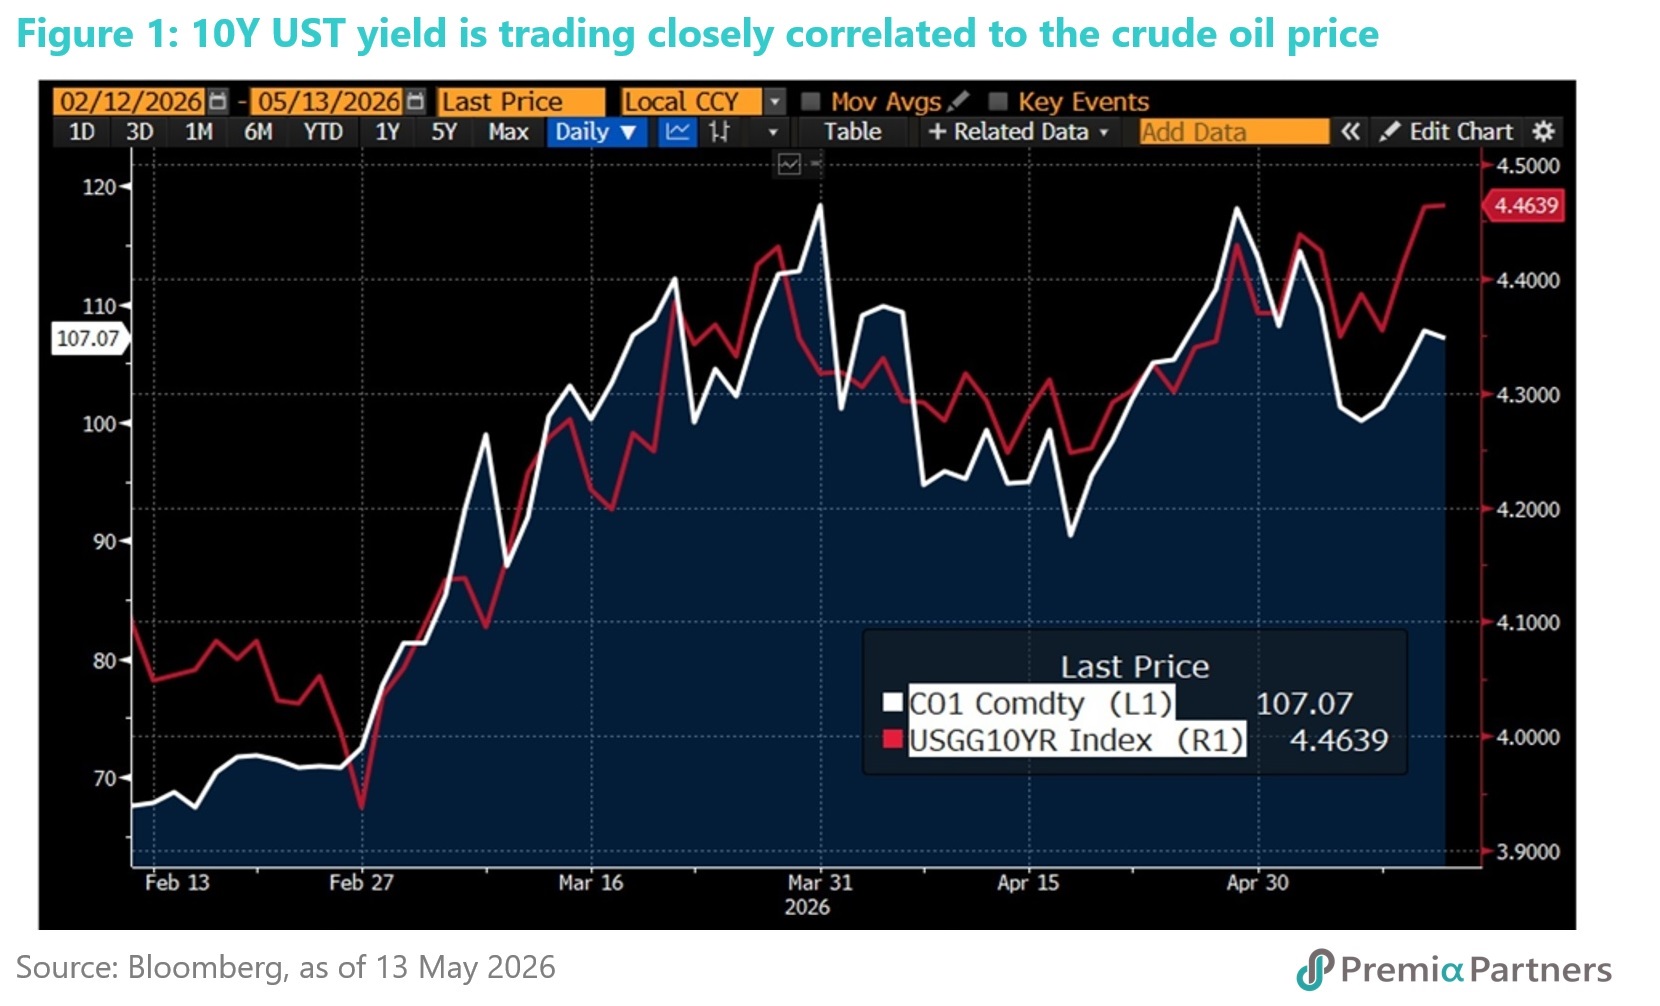
So instead of being a “safe haven”, the 10Y UST is now an inflation play, with the 10Y yield trading closely correlated to the price of crude oil since the start of the War (figure 1).
Demand for US Treasuries at current yields and a “break-the-glass” crisis moment. Former U.S. Treasury Secretary Henry Paulson recently called on the US government to create a "break-the-glass" contingency plan to manage a potential sudden collapse in demand for US government debt. He warned of the risk of a "vicious" crisis worse than 2008, driving up interest rates.
“What we know for sure is that there is going to be inflationary pressures, we know that interest rates are going to be higher, longer…. The deficit is $1 trillion. We are on a path to have it at $3 trillion by 2035. We use the word ‘unsustainable’ a lot, but this is on a path to destroy our economic well-being and our national security which is rooted in our economic strength.,” he said in a Bloomberg interview.
“Radical uncertainty” and UST yields. Former Bank of England Governor Mervyn King, in his book “The End of Alchemy”, wrote of the risks of “radical uncertainty” – that is “uncertainty so profound that it is impossible to….attach probabilities”. So, if the market cannot attach probabilities, it cannot rationally model the risk. President Trump’s unpredictable, some might even say “erratic”, policy and negotiating style represents an extreme form of “radical uncertainty”. So, if the market is struggling to price the risks of War and inflation, its reaction function may become much more volatile, and it may just choose to push up the term premia very significantly, just in case.
Mispricing US equities even at the current “risk free rate”. The S&P 500 index is now trading at 21x forward earnings. With a 10-year UST yield of 4.3% (up from 3.9% on February 27), that translates to an equities risk premium of 50 basis points, compared to 68 basis points on February 27. It is either that the world is now a better place than before the War or there is a mispricing of risk. The longer the war, the higher the inflation rate, the higher the risk-free rate. US stock valuations are going to be severely challenged to maintain current multiples, simply on a rising discount rate, assuming all other things being the same.
Can President Trump’s preferred candidate for the next Fed Chair, Kevin Warsh, challenge the upward pressure on rates? Perhaps the first question should be “will Kevin Warsh even challenge it”? He has a history as an inflation hawk. Amidst strong inflation pressure, he risks debasing his credibility, severely, if he turned inflation dove. At a recent Senate Banking Committee hearing, Mr. Warsh pushed back at a Democrat Senator’s characterisation of him as President Trump’s “sock puppet”. He said he would never, “ever agree” to “commit to any particular interest rate decision”, and President Trump never asked him to.
The FOMC is turning hawkish. Even if Kevin Warsh wanted to cut rates, there are limits to the Fed Chair’s power. The Fed has a simple majority basis for its decisions, and the Chair has one of 12 votes. Meanwhile, the mood at the FOMC has started to shift more hawkish. At the April 28-29 FOMC, three voting members dissented against the FOMC Statement’s use of the words “easing bias”.
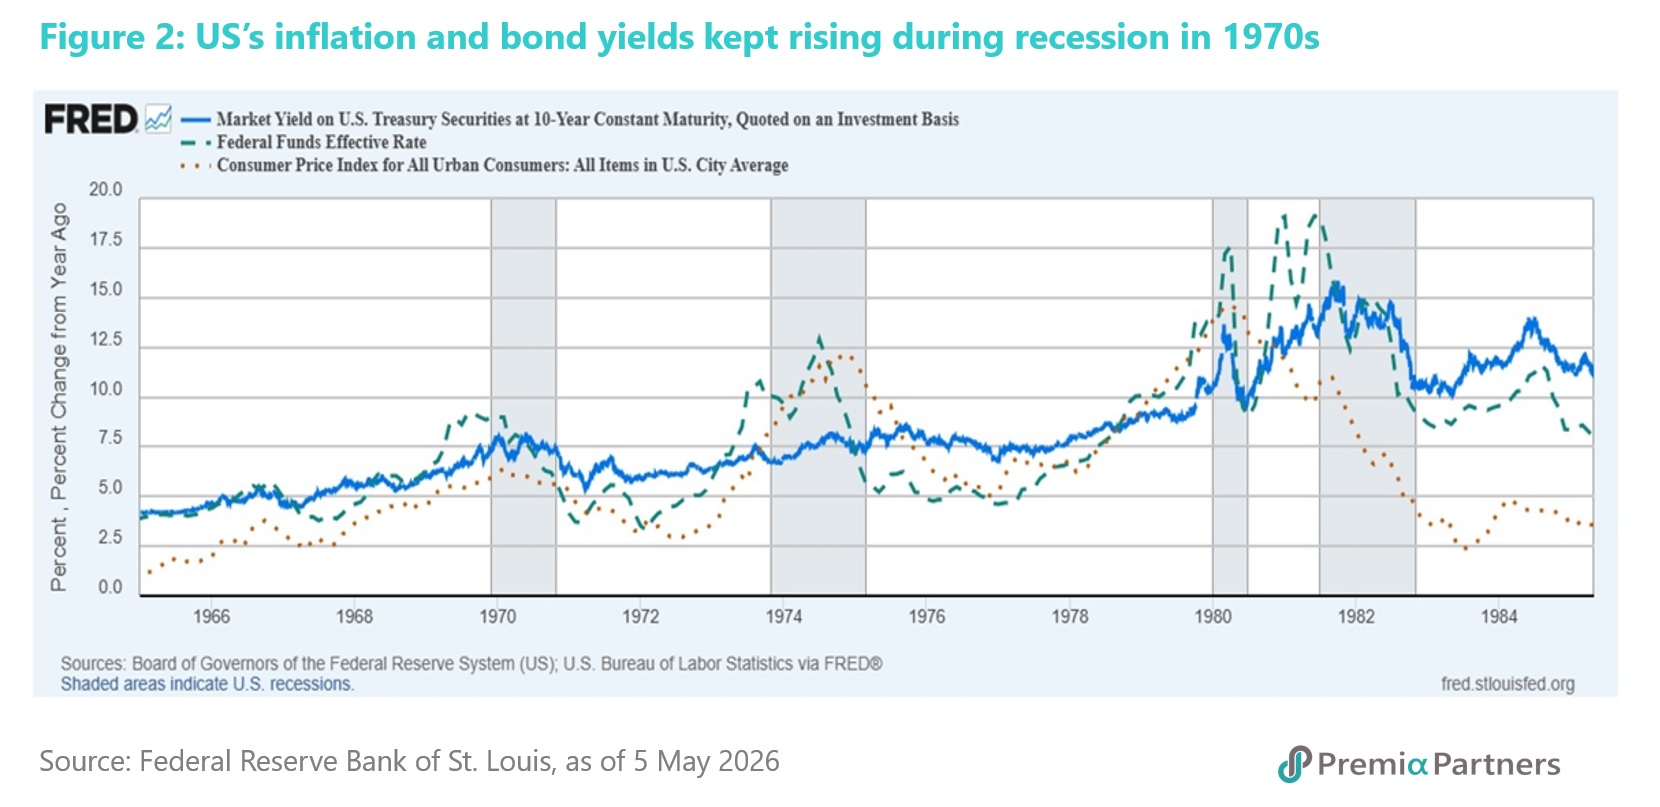
Challenging the market and the lesson of the 1970s. The market also sets limits on the ability of the Fed to cut rates. Indeed, a dovish Fed in the face of rising inflation could accelerate UST yields upwards. If the market fears the Fed is going to worsen inflation by cutting rates amidst rising consumer prices, it is likely to demand more compensation for the risks of higher expected inflation and higher real term premia. This was one of the lessons of the 1970s, when the Fed cut rates in response to the stagflationary recession of 1973-74. Runaway inflation then was the result of surging oil prices caused by the Arab Oil Embargo triggered by the Yom Kippur War. The 10-year UST yield kept rising while the Fed was aggressively cutting. The result was an economic disaster for the US – two recessions between 1980 and 1982, CPI inflation peaking at over 14% and the 10-year UST yield hitting over 15% (figure 2).
The China resilience alternative. Surging oil prices affects everybody. But this has come at a time when US inflation, rates and yields are already elevated, while China has more buffers in its macroeconomic environment. The CSI 300 has outperformed the S&P 500 since the start of the War. The CSI 300 is up 5.1% from February 27, against 2.1% for the S&P 500. China’s economic and stock market resilience was noted in a recent Goldman Sachs report which said that “the Chinese economy appears better positioned amid the oil supply shock than its global peers.”
Energy resilience featured prominently in Goldman Sachs’ view of China. “The Chinese economy appears better positioned amid the oil supply shock than its global peers, owing to its: a) strategic energy diversification efforts, with crude oil and LNG accounting for 28% of China’s primary energy consumption in 2024, one of the lowest in the world. On the flip-side, alternative/renewable energy, notably nuclear, wind, solar and hydro, now represents 40% of China’s electricity generation, up from 26% a decade ago; b) rising oil reserves, encompassing strategic and commercial stockpiles, are close to 1.2bn barrels based on official statistics, sufficient for +110 days of oil consumption assuming the entire crude imports fall to zero; and, c) continued access to oil and gas supply from energy producing nations outside of the Middle East region, Russia, Australia, and Malaysia in particular,” Goldman Sachs said.
End of deflation could lift China’s corporate profits and earnings growth is already emerging as a strong signal for alpha in the onshore A shares market. Goldman Sachs said: “China could end its 41-month PPI deflation as early as in March primarily because of surging global energy prices, 6 to 9 months earlier than their prior forecast. While investors are generally skeptical about the positive impacts of cost-push inflation on the stock market, rising PPI has historically been associated with robust corporate profits and decent equity returns, even during periods when inflationary pressures were mostly instigated by higher input costs (e.g. 2011, 2017/18, and 2021). In fact, Chinese nominal GDP growth has been revised up by 0.8pp (per GS estimates) since the Iran war started, arguably a moderate tailwind for companies’ revenue growth and upstream sectors’ profitability. This could also help alter the disinflationary corporate behavior and consumer mindset, with lower real interest rate likely supportive of corporate capex and asset reallocation flows from cash/savings to the equity market, everything else being equal.” We note that China’s PPI turned positive in April – the first time since October 2022.
China’s renewable energy and electric vehicle (EV) supply chain revolution of the past two decades has prepared it well for this moment. We have written a great deal about China’s technology and innovation revolution in previous insights over the years, including about EV sales growth and battery technology advances see earlier Premia research on this, and China’s renewable energy, energy storage systems, and smart grids here for more analysis.
Bloomberg weighed in on this recently saying: “The Iran war has highlighted China’s efforts to bulletproof its economy by building up its oil reserves, rapidly adopting renewable energy and diversifying its export economy. It’s the country’s investment in clean energy such as batteries, solar panels and electric vehicles that is paying dividends during the oil crisis. In Europe, Chinese automakers are regaining their mojo, with their share among fully electric cars rising two percentage points to claim 8% of the total market, nearly double from last year. Soaring fuel prices could give Chinese brands further momentum by accelerating EV adoption and lifting demand for hybrids, according to Bernstein analysts, adding that BYD stands to benefit the most.”
Forward PE valuation at 45% discount to the US. The MSCI China’s forward PE ratio is almost half that for the MSCI US – at 11.5x versus 22.3x for the US. That 6.6% earnings yield is way over the 10-year CGB yield of 1.75% and the 10-year UST yield of 4.5%. Meanwhile buoyed by good news of positive earnings growth especially for the hard tech sector leaders, in the onshore A-shares market domestic investor sentiment also turned visibly positive with increasing level of margin financing and new account opening.
Not only that this round of rally has been driven by recovery of operating margin and earnings growth, instead of multiple expansion, and with domestic asset owners like pensions and insurance companies dialling up domestic equity allocation, it appears that the government is facilitating a long-term rotation of household wealth out of property and low-yielding deposits and into the onshore equity market.
At this point, it is increasingly clear that China equities is not only a tactical trade, but more global investors are becoming increasingly aware of the pivot and structurally positive, especially for onshore A shares market where a lot of unique hard tech leaders sit. Compared to mainstream mega-cap strategies where these opportunities are typically missing, Premia China STAR50 ETF (3151 / 9151 / 83151 HK) which covers the top 50 companies would be the appropriate tool to consider. The strategy covers sector leaders across the AI, semiconductors, humanoid robotics, biotechnology, and new energy ecosystem, and continues to benefit from the vibrant evolution of the STAR Market as more new listings of hard tech leaders, including emerging frontier areas such as quantum computing and space technologies, join the cohort.
For investors seeking broader representation of China’s policy beneficiaries, Premia CSI Caixin China New Economy ETF (3173 / 9173 HK), with a robust track record since 2017, is an all-cap strategies covering a diversified basket of around 300 new economy sector leaders in the onshore A-shares market including the STAR Market. It would be a great tool for portfolio completion complementary to offshore China, emerging markets and global exposures.
