
The US stock market is now in the grip of “Trumpian euphoria” because President-elect Donald Trump will likely be supportive of even stronger growth, through more debt and deficits and extreme economic nationalism.
Yet, growth should be seen through the prism of quality and sustainability, rather than just quantity. Simplifying GDP growth to the sum of the deltas in the workforce and productivity, the longer-term risks are that President-elect Trump’s pledges on mass deportations will reduce the labour force and his new protectionism will likely reduce productivity.
Nevertheless, short-term, his apparent willingness to run up bigger deficits and more debts will boost GDP growth and corporate earnings. Put simply, debt borrows consumption from the future to drive economic growth today. But by that definition, it does not speak of quality or sustainability – it diminishes future growth prospects for immediate gratification.
Trump’s threat to punish countries that try to bypass the Dollar in trade reflects the vulnerability of the US condition – it needs dominance of the global debt market to sustain its ever-expanding debt pile. That is, US twin deficits require the constant issuance of sovereign debt, which then creates a large and liquid market for surplus generating economies to invest. Those investments then support US deficits and so the cycle goes on.
The imminent risk now is that the US will have to pay more for its borrowings despite its dominance of the global debt market. This is not about other countries bypassing the Dollar in trade. It is about inflation –which will likely be worsened by President-elect Trump’s inflationary policies – and the term premia. It is also about the relentless rise in US government debt over the past half century – from an average increase of around $46 billion per year during the 1970s to an estimated annual growth of $2.75 trillion over the next 10 years. With the equities earnings yield now almost equal to the 10-year US Treasury yield, the incentive to hold US stocks will diminish if there is a further rise in that “risk-free” rate.
US equities are, in our judgment, in a bubble. Trumpian Euphoria 2.0 is just the latest of the “manias” to grip the US market since the rebound from Covid. The first was driven by the pandemic triple bazookas of zero rates, the greatest fiscal stimulus since World War Two, and the biggest monetary expansion in post-War US history. The second – and still ongoing – is AI-mania. Artificial intelligence is transformative. Just as the internet was transformative, it did not mean valuations during the dotcom era were justified, and it does not mean that all those investing massively in AI today will benefit from its transformative effect.
Yes, bubbles can go on for quite a while before they burst, particularly if they have credible narratives and are assisted by central banks unwilling to allow business cycles to periodically wring out excesses. Yet, unless the Fed has developed a formula for “perpetual spring” – and we think not – there is a price for postponing these cycles. And with that there is heightened risk, which should call at least for greater diversification.
Signs of a bubble are flashing for US stocks, but as always, the party goers won’t leave until the lights go out. The hallmarks of a bubble recently prompted Bloomberg to ask rhetorically: “Is it all too good to be true? Bitcoin has been rallying to the moon, meme stocks are surging for (as usual) no good reason and bearish bets are cratering.”
Have a look at the valuations below. Our take can be summed up in the title of that old (Prince) pop hit, this is a “party like it’s 1999.”
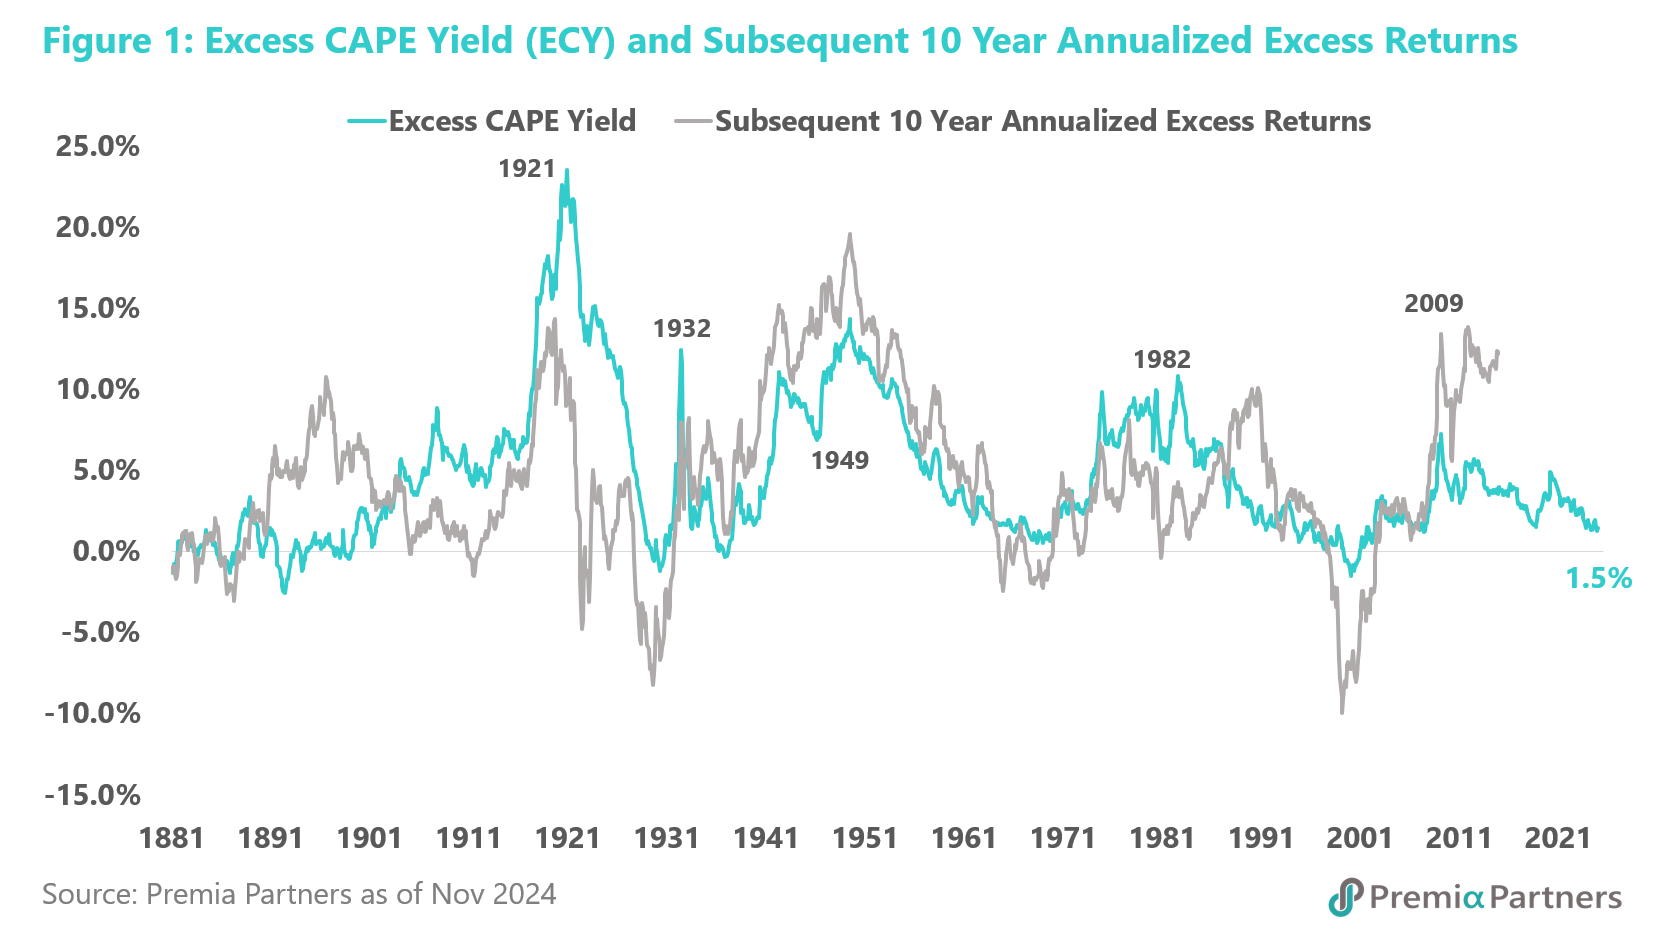
Eventually, the market will look back at fundamentals when it all ends in tears – so it may be worth looking at them now. Bubbles can last quite a while before they burst. But it is worth noting the risks ahead of that grand finale: The volatility index VIX is approaching all-time lows; the S&P 500 price to book ratio is now at 5.4x, way over the Nasdaq Bubble high of 5.0x; the Shiller CAPE ratio is now 39x, the second highest in its history, next only to the pre-Nasdaq Crash peak of 44x; and the US equities yield gap over the 10-year UST yield has gone slightly negative, which is the lowest since the bear market of 2000-2002. You get much the same outcome when you calculate the “excess yield” gap using the inverse of the CAPE ratio instead of the inverse of a simple forward PE ratio (figure 1). This is not a great setup for likely forward returns.
The market may not care about fundamentals now. But that does not mean that fundamentals have been suspended. It just means they continue to be stretched.
Earnings expansion is part of the bullish narrative for US equities but at what price growth? The S&P 500 bull market over the past four years has been a combination of earnings growth and valuation multiple expansion. However, at this stage, the price for growth is no longer cheap. At the valuation-low during the pandemic, the PEG ratio for the S&P 500 was around 1.0. At the time of writing, the forward PE ratio was 22.3x. Analysts were predicting 15% earnings growth. That resulted in a PEG ratio of around 1.5.
Then consider how over the past 25 years, the US market has overestimated actual earnings one year ahead by an average of 6.3%. If we moderated the current forward earnings estimate for that average overestimation, the forward PE ratio would be 24.5, with an earnings growth rate of 7.4%, giving the market a PEG ratio of 3.3. Of course, averages are simple arithmetic constructs. But you can similarly work out different scenarios in which earnings “misses” could push an already high PEG to unsustainable levels.
As an international comparison, using the MSCI China as a proxy, Chinese equities’ forward earnings growth is estimated at 9.2%, against a forward PE ratio of 10.2, for a PEG of 1.1.
There are always risks with any earnings growth estimate – anywhere. But one risk stands out for the US market – the contradiction between the expectations of stronger GDP/earnings growth and continued disinflation and interest rate cuts in 2025. Goldilocks has always been about “having your cake and eating it too”.
Stubborn or even revived inflation are credible risks in 2025. US inflation has rebounded in m/m terms from the lows in May (for PCE Inflation) and June (for CPI inflation). The Fed decision to cut its target rate by 50 basis points in September was presumably on the belief that inflation had been defeated and the emphasis could then switch to defending the labour market. However, the data is going the wrong way – inflation is lifting again and the jobs market has been resilient. In line with that labour market resilience, wages inflation has been gradually drifting higher in m/m terms most of the year and in y/y terms since July.
The Fed cut a total of 100 basis points in 2024, and is now signaling reductions of another 50-basis points in 2025. Significantly, between the September and December FOMC, it changed its median “projected appropriate policy path” for rates by end-2025 from 2.9% up to 3.4%. The idea of 100 basis points in cuts in 2025 was totally against the data suggesting a resilient economy and stubborn inflation. Even 50 basis points may be too dovish. It is possible of course but therein lies a risk of disappointment for equities priced for perfection. Interestingly, the OIS market, after the December FOMC, priced only one rate cut in 2025.
Inflation – cyclical risk converges with Trump’s structural threat. Amidst Trumpian euphoria, the market prefers to celebrate promised tax cuts than worry about inflation as a policy risk. But it is a risk, nevertheless. According to the US Committee for a Responsible Federal Budget, President-elect Trump’s policy pledges would increase Federal Government debt by $7.5 trillion over the next 10 years. This is additional to the impact on debt from deficits from the pre-existing budget structure.
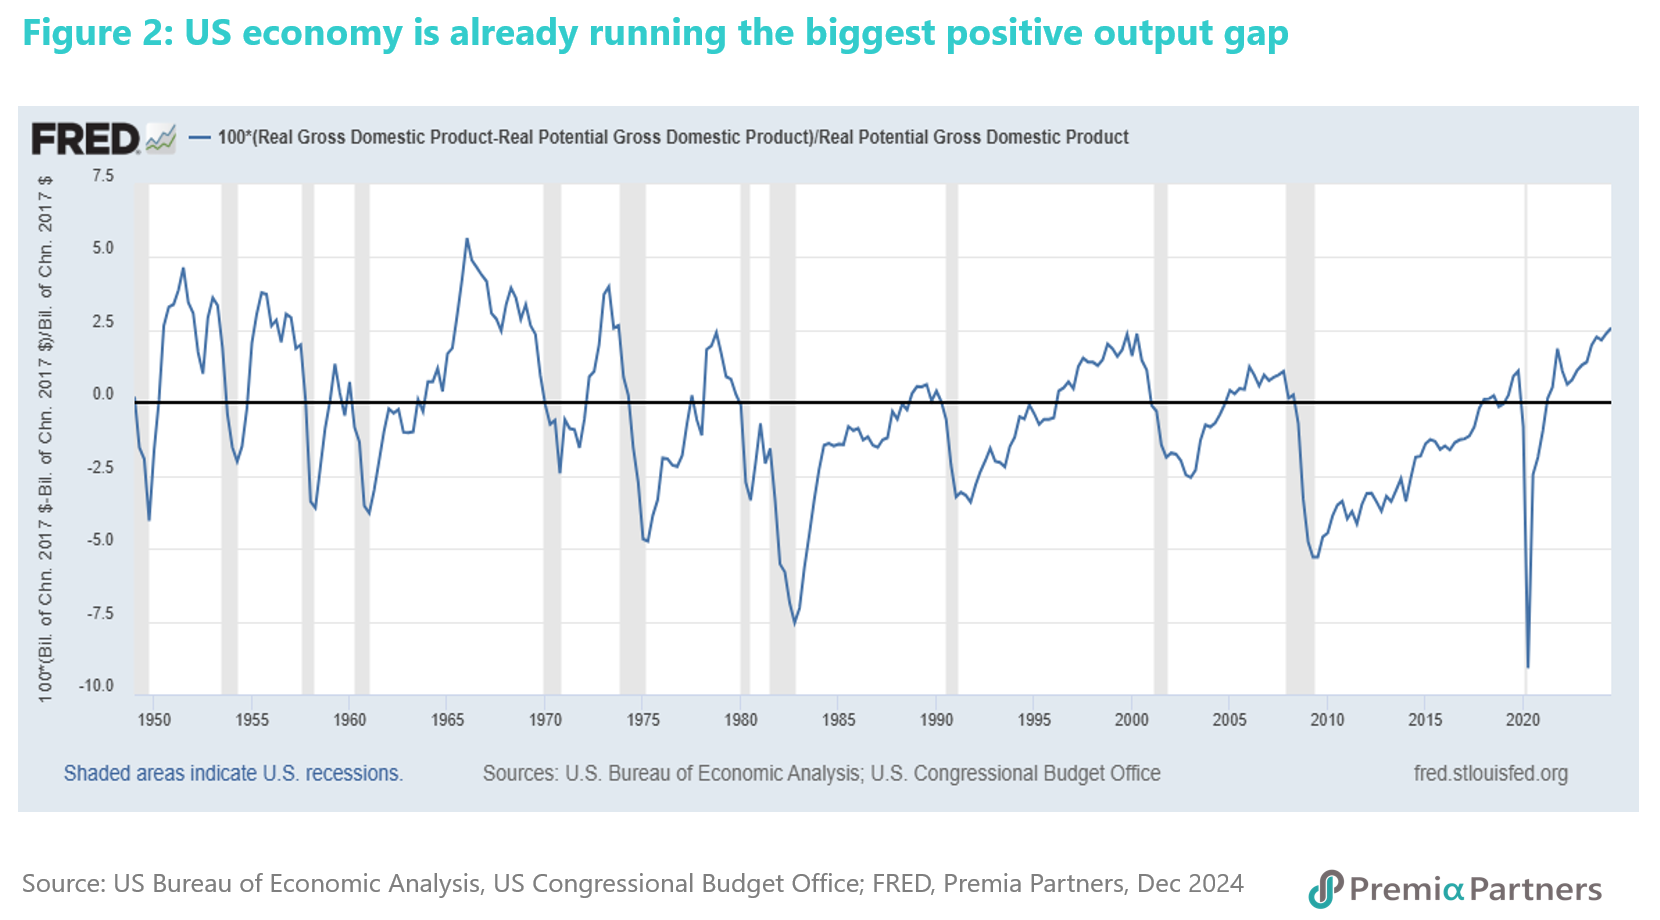
US “need for speed” is likely to push the economy to run at even higher levels of overcapacity. The US economy is already running the biggest positive output gap (that is, real GDP minus real potential GDP) relative that real potential GDP since the Great Inflation that ended in the early 1970s (figure 2). And President-elect Trump wants to pump it up even more.
Mass deportations and massive tariffs – all highly inflationary. The above risk is only about fiscal promises. Beyond those, Donald Trump has extraordinary policies to deport millions of illegal immigrants and impose steep increases in import tariffs. The Peterson Institute for International Economics warned that the combination of higher tariffs, deportation of illegal immigrants and erosion of the Federal Reserve’s independence could “cause the US inflation rate to climb to between 4.1 and 7.4 percentage points higher than otherwise by 2026…..That means, on top of baseline inflation of 1.9 percent, inflation peaks then at between 6 and 9.3 percent.”
Of course, these estimates are theoretical, and on the assumption that President Trump goes through with what he promised. But you don’t need to get to those theoretical peaks of inflation to roil a market that is priced at 5.3x PB, 1.5x PEG, and a yield gap of zero.
Forever stimulus – “maxing out” on the unsustainable. There are cycles and there are secular trends. For the US economy, the cycles of fiscal deficits to GDP, Federal Government debt to GDP and M2/GDP have been movements around rising secular trends. Note that more recently, M2 money supply has been turning up again from its lows in 2023. There has been a historical tendency for rises in inflation to follow surges in money supply, albeit with a lag. The above are manifestations of an intolerance of cycles, leading to ever greater levels of intervention to soften cycles. The risks are many, with the two biggest being inflation and debt sustainability – with the latter being dependent on the world being prepared to be “price-insensitive” buyers of an ever-growing pile of US government debt.
Already “fully priced” at the current index level and discount rate, US equities face the risk of continued increases in US Treasury yields. Oddly, the 10-year UST yield bottomed in mid-September at around 3.6%. At the time of writing, it was over 4.5%. That turnaround in the yield coincided with the first Fed rate cut. The bond market appears to disagree with the Fed on the necessity of that 50-basis point rate cut. Indeed, it may be pricing in the impact of that rate cut on inflation, and the impact of the second Trump Presidency on deficits and debt.
The coming tsunami of US Treasury issuance and the vanishing buyers. US Federal debt has gone from $23.2 trillion at end-2019 to $35.5 trillion by 3Q24. That was growth of $2.6 trillion a year. That’s history. Looking forward, according to a Congressional Budget Office estimate from early 2024, the US Federal Government will run deficits that will add another $2 trillion to that debt every year. That estimate however was probably conservative on hindsight, as it did not take into consideration the likely expansion of deficits under President Trump. See our earlier reference to the US Committee for a Responsible Federal Budget’s estimate that President-elect Trump’s policy pledges would increase Federal Government debt by another $7.5 trillion over the next 10 years.
We acknowledge that this estimate takes President-elect Trump at his word, without considering possible offsets not explicitly cited during the election campaign. With that caveat, the rough and ready estimate is the US Federal Government will have to finance around $2.75 trillion in additional debt each year over that period.
That is before refinancing maturing, existing debt. For example, the US Treasury has to find investors to refinance maturing government debt, estimated at $9 trillion in just the next 12 months.
Meanwhile, foreign, sovereign buyers have been reducing their holdings in US Treasuries, and with quantitative tightening, even the Federal Reserve has been reducing its holdings. The US Treasury will have its hands full juggling supply and demand over coming years.
A recent report by State Street noted the “persistent decline in holdings by price-insensitive buyers, such as the Fed and foreign official institutions” and the increase in “price sensitive” domestic private investors such as households, hedge funds, insurance companies and pension funds.
The report/analysis concluded that yields needed to rise 95 basis points to absorb the additional Treasury supply. Mind you, that was based on new supply of $2 trillion a year, not something substantially more than that under Trump Presidency 2.0.
According to analyses published by the Federal Reserve Bank of New York, using two separate models, the term premium for the 10-year US Treasury yield hit a very long-term low in 2020 – the lowest in around 40 years – and has been rising since. If year 2020 was a secular low, a convergence of that secular low with three other factors – a Fed reluctance to pay the price to crush cyclical inflation, a fiscally expansive new Administration in the White House, and a seemingly irreversible surge in government debt –could prove very damaging to US stock and bond investors like.
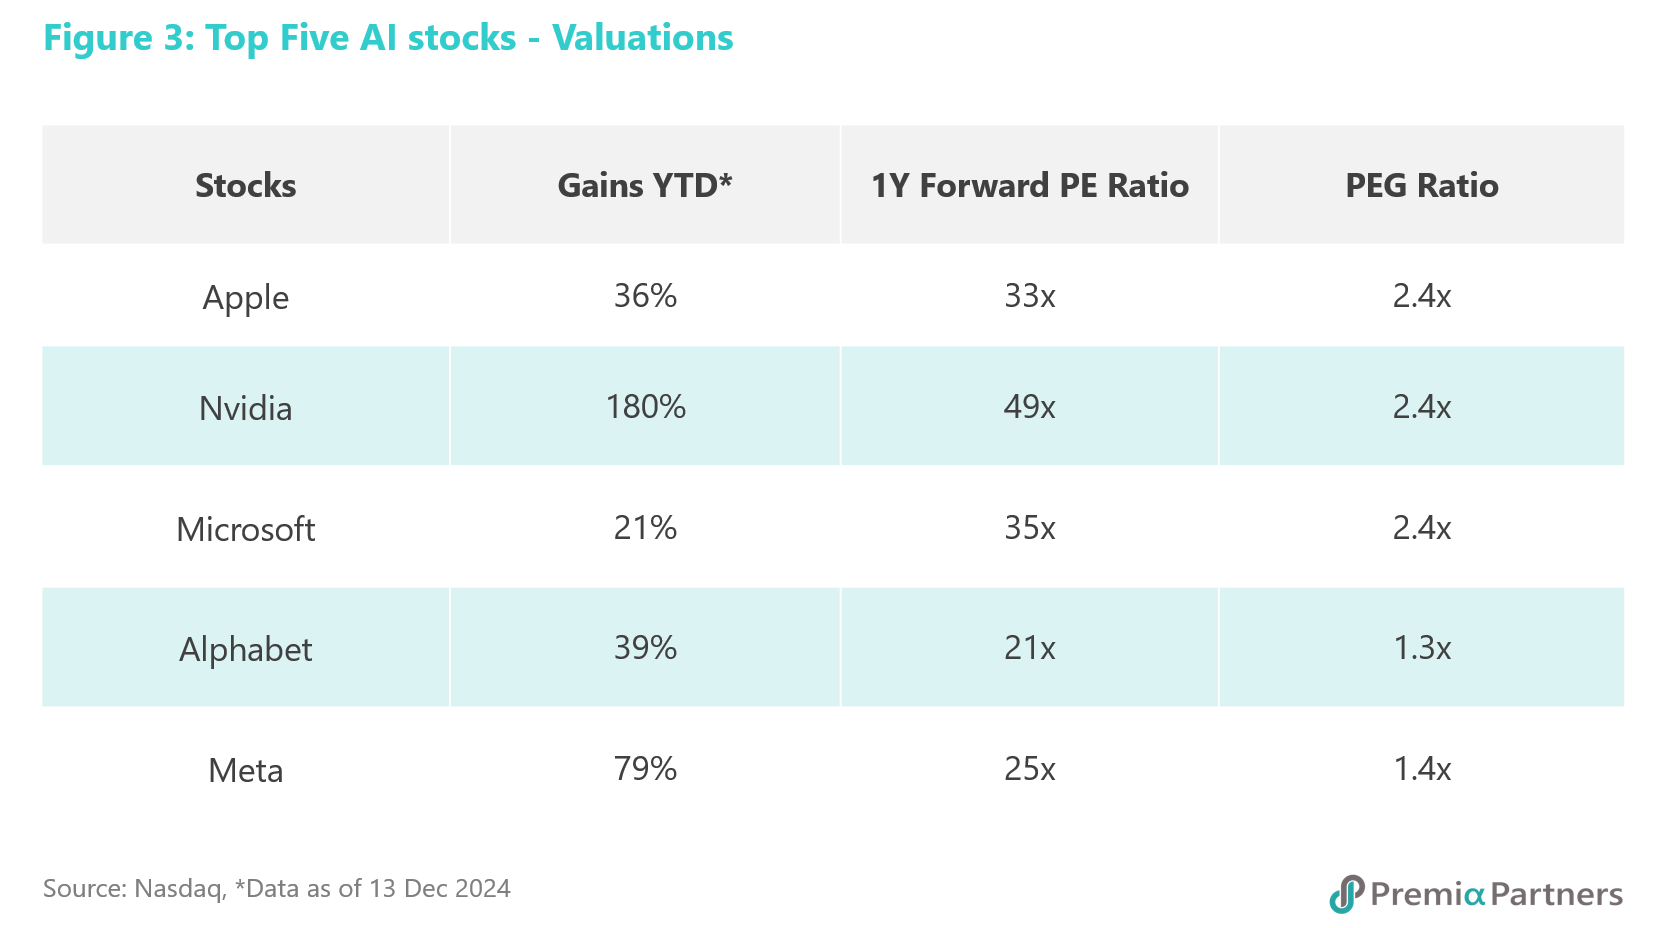
AI mania – future earnings promise versus present funding needs. Artificial intelligence is transformative. But it also sucks up a huge amount of energy and capital expenditure. At the company specific level, the massive gains by the top US AI-stocks over the past year and (very) high valuations have burdened them with huge earnings expectations (figure 3). In the event of earnings disappointments, the impact would be felt across the entire S&P 500 index as just five stocks account for 27% of the index.
AIM Research, a specialist in AI and data science research, estimated that just four US Big Tech companies – Alphabet, Amazon, Meta and Microsoft – spent over $300 billion on AI research and development in 2024. Further, major tech companies will spend another $1 trillion over the next five years. The figures on US Big Tech investments in AI varies depending on the source. Yet, it is indicative – it’s huge. The risk is a lot of that will disappear into the proverbial “money pit”.
Sequoia Capital has been doing some interesting numbers crunching on the revenue required to pay for the investments. Its 4Q 2024 estimate was $600 billion. Writing earlier this year, Sequoia Capital said OpenAI’s annualised revenue was reported at $3.4 billion. It then assumed that each of Google, Microsoft, Apple and Meta will be able to generate $10 billion annually from new AI-related revenue. It also assumed $5 billion in new AI revenue for each of Oracle, ByteDance, Alibaba, Tencent, X and Tesla. But that still left a “$500 billion (revenue) hole”, it said. While capex will begin to stabilise in 2025, “ROI will remain problematic”.
While we believe AI is transformative, an issue now is that a “killer app” has yet to emerge. When that killer app does emerge, it might turn out to be a winner-takes-all situation, where there might be a lot of wasted money and shareholder value destruction in much of the sector.
