
featured insights & webinar

The recent falls in equities were more than just about the US Federal Reserve “disappointing” the market with its rate guidance. Equities bulls got the 25 basis points cut they expected. But they wanted more – they wanted Jerome Powell to assure them there will be many more to come.And while President Donald Trump didn’t help by ratcheting up the trade war with China, you couldn’t say that was totally unexpected either. Indeed, I had been saying that the so-called “ceasefire” promised by the US President at the G20 meeting in Osaka was not even a truce. It was a temporary freezing of the conflict at existing levels, with the potential for escalation later. In short, good enough is not enough for the market. It wants perfection. Why not? US stocks have been priced for perfection. Nevertheless the global economy had been weakening while stock markets were pushing higher. Perversely, equities were moving higher because economic fundamentals had been deteriorating. This is bad news as good news, as the global economy fumbles along, with growing uncertainties heading into 2020.China just reported the slowest economic growth in 27 years for 2Q19 – at 6.2% y/y versus 6.4% for 1Q19. This is not all cyclical. There is a structural element to the story too. But whatever the story behind the data, the slowdown has impacted and will continue to affect world economic activity.Singapore – often described as the “canary in the coalmine” for world trade – turned in an annualised 3.4% GDP contraction in 2Q19 over the previous quarter. This was the worst GDP figure since 2012.Reflecting the same trade drag, the Japanese Government has downgraded its forecast GDP growth for the current fiscal year (ending March 2020) from 1.3% to only 0.9%. But the private sector is only expecting 0.5% growth, according to Japan’s Cabinet Office. This suggests a recession in Japan this year.Indeed, Japan may already be in the midst of a recession, which may be confirmed only later this year. Japanese GDP contracted 0.4% in May, according to estimates from the Japan Centre For Economic Research. The economy was dragged down by external demand which fell 120 basis points amidst falling export data. Exports fell again in June – by 6.7% y/y, following a 7.8% decline in May – making it the seventh consecutive month of falls in exports.Euro Area GDP should come in around 1.2%--1.3% for 2019. But data suggests likely deterioration in the second half of this year, with the preliminary, “flash” manufacturing Purchasing Managers Index (PMI) falling deeper into contraction with a reading of 46.4 for July from 47.6 in June. The US economy also slowed significantly in 2Q19, with growth down to 2.1% from 3.1% in the first quarter. While the economy is still growing, the market is surely aware that the Treasury spread between the 10 year and the 3-month bill rate is now negative. That is, the yield curve has inverted. The New York Federal Reserve has assigned a 32.88% probability of a recession by June next year. That was where we were around August of 2007, just before the start of the Great Recession. The market is also surely aware that over the past half century, every time that spread goes over 30%, the US has had a recession. Indeed, this is so well known in the market, it just about elicits a yawn.Global manufacturing is likely to already be in a recession. Japanese and Euro area manufacturing purchasing managers’ indices have been in contraction since February. China’s official PMI has been flitting in and out of contraction since the start of the year. US manufacturing PMI has slumped to the 50-point borderline between growth and contraction. Yet, the manufacturing output index is already in contraction. There is an argument in the market that manufacturing recessions are not that important these days because of the diminished role of manufacturing in GDP. Growing services PMIs are still holding up composite PMIs. However, there is still a broad relationship between US manufacturing and services PMIs, add or subtract some time lags and occasional breaks in the relation. Dismissing the likelihood of a prolonged manufacturing recession triggering a broader recession seems reckless.Long before the equities fall of recent days, various measures of market breadth suggested lack of broad participation in the rally.Over the past 12 months, defensive sectors led the US market rally – with utilities up 17.1% for the 12 months to late July, and consumer staples up 17.0%. Yet, cyclicals lagged, with materials barely changed. Another divergence is between small cap/mid cap versus large cap stocks – with the Russell 2000 down around 3.8% over those 12 months.The ratio of consumer discretionary to consumer staples – which Jesse Felder of the Felder Report called his “equity risk appetite” measure – had been muted even as the S&P 500 index was pushing higher. In a similar vein, the CBOE VIX had generally been trending higher from early 2018 even while the S&P 500 was pushing higher, albeit with a lot of choppiness. This is in contrast with the decline in volatility in the US equities rally from early 2016 to late 2017. And as Felder also notes, the BBB corporate bond spread had also been generally rising since 2018 – that is, diverging from the “risk-love” in equities – even while the S&P 500 was rising.Notwithstanding considerable nervousness among investors, the calculations of the bulls were that: 1) this time could be different because of likely renewed monetary stimulus; 2) even if it isn’t different, the US is still a good year away from a recession on historical indications; 3) traders can pick up some further gains and clear out before the bad stuff hits.Well, the Federal Reserve has started to cut rates. Notwithstanding what Jerome Powell says the future is, the future path of rates is, as the Fed likes to say, “data dependent”. Meanwhile, the European Central Bank will likely take its deposit rate deeper negative and renew quantitative easing.The market’s calculation was that this should push yield deprived savers back into risk assets, bearing in mind the huge recent flows into bonds, and the rising flood of negative yielding bonds. That could still happen again notwithstanding the recent selling of risk. Bloomberg Barclays Index data showed US$13.6 trillion of negative yielding bonds worldwide in late July, more than double the US$5.9 trillion in October last year.That explains the surge in gold from US$1186 per oz August last year to US$1425 late July. As rates go lower or indeed, deeper negative, gold is likely to continue higher. And of course, the point of all this is that, governments and corporations can then borrow even more than they have done over the past 10 years.If you accept the logic that debt borrows from future economic activity, we are digging bigger and bigger holes to fall into in the future. But none of that constrained punters up until a week ago because their calculations were much shorter than that.To repeat, of course the market knew the New York Fed’s recession probability calculation, and its historical significance. Yet, some thought this time would be different because of the likely resumption of monetary easing all over the world. Even if that failed to rev up the economy, there was still time to clear out of risk assets before the final denouement.There could still be time after a brief sell-off. I won’t pretend to know if this is the beginning of that “final denouement”.But I do believe that at best, this is like an accelerating game of “pass the parcel”. The players know the music will end soon. They therefore pass the parcel with increasing speed, to avoid getting caught when the music stops. Yet, the risks are rising rapidly. With the cyclically-adjusted price to earnings (CAPE) ratio for the S&P 500 reverting downwards from cyclical highs, market sentiment is fragile. The risk of an increasingly manic-depressive “Mr Market” being disappointed with Jerome Powell, Donald Trump or the economy, etc, is high.So, what do you do if you are not into rapid games of passing the parcel? Here are some options: 1) Hedge out as much beta risk as possible through market-neutral long-short funds. 2) Seek out markets with low correlations to major markets – e.g. Vietnam. 3) Ride the return of monetary debasement through gold. 4) Keep your financial “powder” dry – park your cash in a short-duration, risk-free, instrument that pays you some returns while you wait for better valuations. With the yield curve inverted, an instrument tied to the short-end is preferred over the longer end. That is, prefer the 3-month over the 10-year.Related Premia ETF tickers Vietnam: Premia MSCI Vietnam ETF – 2804 HK / 9804 HK Ultra-short Duration: Premia US Treasury Floating Rate ETF – 3077 HK / 9077 HK
Aug 05, 2019
Vietnam is seen as the country benefited from the trade war between China and the US. Samsung is assembling half of its mobile phone in Vietnam and Apple is also beginning to start the production in the nation, so it is not surprising if your next iPhone will be made in Vietnam. Investors are enthusiastic about the bright prospects of Vietnam as major upcoming world factory, but Trump’s recent critics lead to a concern if this Southeast Asian country may become the next victim of trade war. We will elaborate further about the trade situation of Vietnam at the moment, the outlook in near future, and the market reaction in this article.
Jul 31, 2019
After a bull run of close to 40% that took most by surprise in the first quarter, trade uncertainties started to really weight on Chinese stocks during the second quarter of 2019. Unlike the beta-driven first quarter, all factors of our interest had positive performance in Q2 while the broad equity market ended roughly flat. But style factors alone are far from sufficient to explain (or reduce) the impact from the geopolitical shocks to the system as there had been much more intricate implications to one’s sector exposures; therefore, we also share a quick review of industry exposures in this piece.
Jul 29, 2019
Previously, we introduced the addition of an MSCI Vietnam strategy to offer exposure to an up and coming market that benefits from trade war uncertainty. This week, we change direction and introduce our solution to risk-free USD yield – the Bloomberg Barclays US Treasury Floating Rate Bond strategy.
Jul 15, 2019
3 of our ETFs recently went through their annual index rebalances. While investors focus mainly on fees and liquidity, the rebalancing and index methodology of ETFs are equally, if not more, important to the investor experience and returns. To that end, we’d like to highlight June’s rebalances and explain what investors can expect going forward.
Jul 13, 2019
Vietnam is increasingly spoken about as one of the biggest beneficiaries of the trade war and as a market to watch going forward. However, the tools to access Vietnam remain limited. On July 18 (subject to final approvals) we will list the MSCI Vietnam strategy to make it easier for investors to access this dynamic and fast growing market.
Jul 04, 2019
The highly anticipated G20 Summit seemed to have concluded in a nice conciliatory note as the world powers converged in Osaka this past weekend. Or did it? While it seemed to have eliminated the “total risk-off” worst case scenario, and perhaps rebuilt confidence for China equities especially the new economy sectors, beyond the rhetoric, what we have is not really a pause in the trade war. The war continues as evident in the tariffs. A more accurate description is that both sides have agreed not to escalate the trade war while talks resume.
Jul 02, 2019
Whatever happens over coming weeks and even months in the US-China trade war, Donald Trump has irreparably broken the global trade architecture. And with it, he has also forced a realignment of the global supply chain that will likely see ASEAN emerge as a new manufacturing centre.
Jun 27, 2019
As we head toward the G20 meeting in Osaka, we take a moment to review the latest status of the trade war between the two largest economies today. Is it about containment or tariffs? How does the current situation compare to Japan in the ‘80s? Do either China or the US actually want to make a deal? What are the possible paths going forward?
Jun 12, 2019
As we approach the end of 1H19, it is clear that the market now finds itself in a tug of war between the Fed Put and the potential for recession. We explore this dynamic, discuss Q1 vs future growth across the 4 major economies (US, Europe, Japan and China) and remind investors to stay defensive going forward by tilting toward value and quality where possible.
Jun 12, 2019
BY TOPICS
Chart Of the Week

David Lai , CFA
CFA
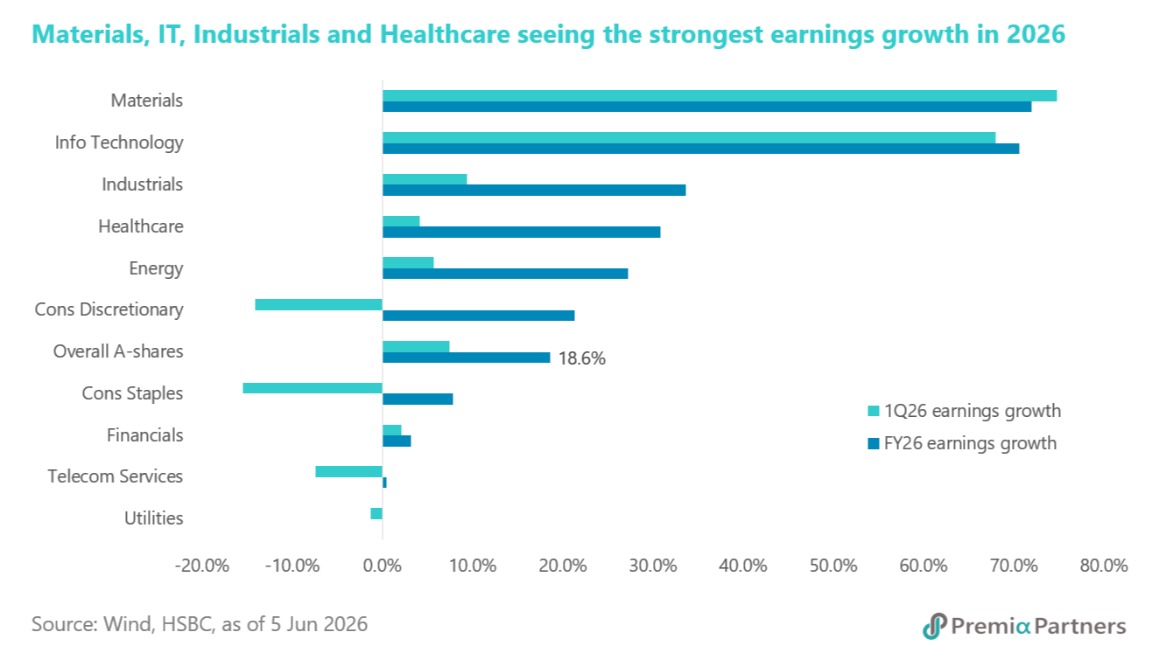
China A-share market has become increasingly polarized, as earnings momentum and growth expectations drove investor flows. While the Information Technology sector has surged 31.9% year-to-date, Consumer Staples have declined 13.8%, illustrating a clear market preference for growth-oriented industries over traditional defensives. The strength of the technology sector is often attributed to the global enthusiasm surrounding artificial intelligence and semiconductor demand, alongside Beijing’s continued support for domestic innovation and import substitution in critical technologies. However, the rally is far from being purely sentiment driven. Corporate fundamentals have provided substantial support. In the first quarter of 2026, Information Technology companies delivered earnings growth of 68.0% year-on-year, second only to Materials at 74.8%. In contrast, Consumer Staples reported a 15.4% earnings decline, reflecting weaker operating momentum. The earnings divergence has also been reinforced by analyst revisions, with full-year profit estimates for Information Technology revised upward by 7.4%, while Consumer Staples experienced a sharp 19.3% downgrade. Looking ahead, earnings growth is expected to remain concentrated in a handful of high-growth sectors. Consensus forecasts point to full-year 2026 earnings growth of 72.0% for Materials, 70.6% for Information Technology, 33.7% for Industrials, and 30.8% for Healthcare, while Utilities, Financials and Consumer Staples are expected to lag. For investors seeking exposure to China’s structural growth themes, the Premia China STAR50 ETF and Premia China New Economy ETF offer targeted access to innovative and high-growth segments of the market, both of which have outperformed the broader A-share market year-to-date.
Jun 15, 2026