
주요 인사이트 & 웨비나

We enter this year at a crossroads for markets, with multiple cycles coming to an end. In his first insight as our senior advisor, Say Boon Lim offers his thoughts on asset allocation amid diverging economic, market and currency cycles. Following his thoughts as a guide, we introduce a number of ETF implementation ideas for 2019 across equities, fixed income, commodities and even currencies.
Jan 25, 2019
Emerging markets seem to be one of the top picks among both sell-side strategies and well-known investors in 2019. We would like to examine if their views are valid and understand better about the reasons behind. To make it into an actionable advice, we also share our thought why emerging ASEAN maybe the crème de la crème and update our readers on the performance of Premia Dow Jones Emerging ASEAN Titans 100 ETF.
Jan 14, 2019
As we wrap up 2018, it’s hard not to reflect on a -25% year in A-shares. As investors, however, we have to look forward and ask ourselves – what’s in store for 2019? Will the trade war result in continued downward momentum? Or will policy accommodation and an improved trade environment result in a massive upside reversal? Looking back 10 years to the global financial crisis, we examine a potential path forward for A-shares in 2019.
Dec 17, 2018
Below is a quick summary of what you need to know regarding this weekend’s G20 Xi-Trump meeting and our thoughts on impact for Asian and Chinese equities.
Dec 03, 2018
For the past 5 years, the surest trade in finance was to bet on US technology stocks and watch market caps double and portfolio returns roll in. However, the last few months have shaken that confidence and now many investors are asking what’s next, given the diminishing growth picture globally. Asian companies focused on innovation offer an interesting opportunity in this regard, especially considering the correction so far and their potential going forward. Though many VC and tech investors have already made the shift to Asia, that move is yet to occur in public equity markets. We believe our Premia Factset Asia Innovative Technology Index, and its corresponding ETF, 3173 HK, should be in every global and tech investors toolkit.
Nov 27, 2018
On the 1 year anniversary of our China A smart beta ETFs, we thought it prudent to reflect on how 2803 HK and 3173 HK have done since launch, as well as take stock of China A-shares markets overall. In this note, we’ll recap the ETF performance and tracking, review China A-shares over the last 12 months, explore which factors worked and didn’t and offer a few thoughts about our expectations going forward. Thanks as always for reading and trusting us with your investments.
Nov 08, 2018
Innovation is increasingly a key requirement for economic growth. The story is no longer about Copied in China, but Made in China. The same is true throughout the Asian region. Unfortunately, until now, there’s been no easy and efficient way to build an Asia Innovation exposure. After months of discussions with clients, followed by months of research and data clean-up, we are pleased to announce the launch of the Premia FactSet Asia Innovative Technology Index. In this post, we cover the rationale, methodology and result of this innovative approach to capturing Asian growth. To ask us a question, or express your interest, click here.
Oct 22, 2018
While the world paints EM with a single broad-brush stroke, ASEAN markets have quietly separated from the rest of EM and may have bottomed out in July. We say quietly because no one is talking about it, with most financial media preferring to focus on the US/China trade war, Turkey’s Lira crisis, Argentina’s rate hike or some other potential problem area. There hasn’t been much news out of ASEAN of late, which may simply be because the story is not one of turmoil and difficulty but of consistent growth and opportunity.
Sep 27, 2018
China markets’ move down YTD has raised a lot of questions for Emerging Market investors, particularly given the MSCI China A inclusion earlier this year (and again in 2 weeks). But is the move down driven by a macro growth story threat, company fundamentals deterioration or a more general risk-off move amid trade war uncertainty. Our CIO, David Lai, offers his point of view on events so far and explores the potential path from here.
Aug 17, 2018
Most investors are familiar with the FAANGs and are giving increasing attention to the BATs as technology firms are disrupting traditional paradigms. Yet, one might be surprised at how significant technology-driven innovations have been reshaping the ecosystem we live in. I prefer the word “reshaping” over “disrupting” as a lot of the innovations and so-called “disruptions” have already proliferated into our blood and our everyday life – for instance, “Digital Revolution” is at the forefront of this transformation and is happening every minute around us.The exponential growth in big data, artificial intelligence (AI), and internet of things (IoT) have led to innovations in various far-reaching implications beyond merely internet and information technology. In this piece, we explore the Asia innovation theme by discussing:• State of Asia innovation• What sectors are expected to be most affected?• How are innovations disrupting traditional industry classifications and the investment landscape?State of Asia innovationAsia is home to 50 percent of the global internet users, 1.8 billion of active social media users, and about US$75 billion worth of unicorn startups. According to statistics from UNESCO on countries’ R&D spending, 3 of the top 5 are Asian countries – China #2, Japan #3, South Korea #5. These 3 countries also collectively account for roughly 40% of world researchers and are among world’s largest robotics markets as well.According to a white paper from Harvard Business Review, leading companies around the world are leveraging Asia’s liveliness and talent to develop new products, services, and business models that drive growth, with many finding or even building innovation ecosystems in Asia. Three commonly cited factors on how Asia differentiates itself from the rest of the world in the pace of innovation are: 1) the faster growing economies compared to the developed Western counterparts, 2) robust and growing demand for products and services not only from the deep and wide range of manufacturers domiciled in Asia but also from the region’s fast-growing middle class, and 3) strong support for the business community from governments that recognize the crucial role innovation plays in growing both companies and economies.What sectors are expected to be most affected?While information technology itself is a sector, with the technological innovation and development of times, technology is now more of an enabler in this modern era. Nearly every industry can find ways to benefit from innovative technologies in an effort to improve output or reduce costs. Apart from the technology sector (e.g. software, hardware), the industries that are at the forefront of experiencing tech-enabled exponential growth in Asia include:Retail: Online retailing along with online-to-offline (O2O) offerings have made shopping easier and cheaper for consumers, which were made possible by lower cost structures and improved efficiency in delivery and logistics. In How is “digital revolution” in Asia transforming the way we live, we discussed how Alibaba’s Tmall and JD.com generated impressive single day sales. In addition, AI and big data are increasingly being deployed by online and traditional retailers to better identify trends and predict customer demands.Industrials: The surge in robotics investment in Asia puts industrial automation at the forefront of Internet of Things (IoT) and implementation of AI in the physical world. With greater precision on the metal arms and an AI mind, advancement in robotics will create smarter, more capable machines to complement or replace the aging human workforce in many fields. Technology advancement will also enable better performance in other areas such as operations optimization and predictive maintenance.Healthcare: The increase in aging population and rising middle class in Asia has led to strong demand for healthcare products. In 2017, about $40 billion dollars were raised for life science projects in the region. Advanced data analytics creates large benefit to pharmaceutical companies on drug discovery and clinical trials. Physiological simulation can accelerate product development, and a 3-D printed or virtual reality-based tissue modeling can help with assessment of potential concerns. AI has also been put into use in diagnostic imaging and robotic surgery. Furthermore, innovation has made patients to be more connected and engaged that now there’s digital pills or nanobots that can go into your body (and blood) to examine and respond real-time data to you and your doctor’s digital devices. Transportation: The transportation landscape is transforming in many different ways and has affected many other sectors - I use “transportation” for the lack of a better word. In the sky, drones with intelligent sensors and accurate GPS positioning has enabled new ways of filing, package delivery, and farming. On the road, we see advancements in electrical vehicles and autonomous driving enabled by technologies in heavy-duty battery, image sensors, and AI algorithms. Further, the IoT era has also spurred the shared-economy concept in transportation from cars to bikes.How are innovations disrupting traditional industry classifications and the investment landscape?About 20 years ago, S&P and MSCI put their collective heads together and created the now commonly-used Global Industry Classification Standard, aka GICS®. Lately, there has been plans for extensive sector revisions, which will be effective toward the end of September this year. The revision hopes to better reflect how modern companies operate in the brave new world, but has also raised questions – for instance, should e-commerce companies like Amazon or Alibaba be Consumer Discretionary? Among the FANG gang, Netflix should also become Consumer Discretionary, while Facebook and Google into the new Communication Services sector along with other Media players like Disney?Information Technology sector ETFs has been a popular and useful way to capture growth opportunities. However, with the increasing amount of technology-enabled innovation across virtually all sectors and industries, it is quite fair to say that investment vehicles indexed or benchmarked to the “GICS = Information Technology” pool has been significantly disrupted, and savvy investors have shifted away from these to thematic ETFs specifically on Robotics & AI, Social Media, Semiconductors, Biotech, etc.While many ETF managers build products on top of broad GICS or ICB classification system, others, including us (Premia Partners), work with index providers to redefine classification, especially when approaching disruptive themes in the old-school industry classifications are slow to adapt to new economic realities. For our upcoming ETF themed on Asia innovative technologies, we work with FactSet to identify relevant companies based on their revenue segments into very detailed levels. The article Targeting Asian Growth Through Innovation gives a detailed discussion into the index methodologies, and you may learn more about the Premia Asia Innovative Technology ETF (3181 HK) at the product page.
Aug 13, 2018
토픽별
주간 차트

David Lai , CFA
CFA
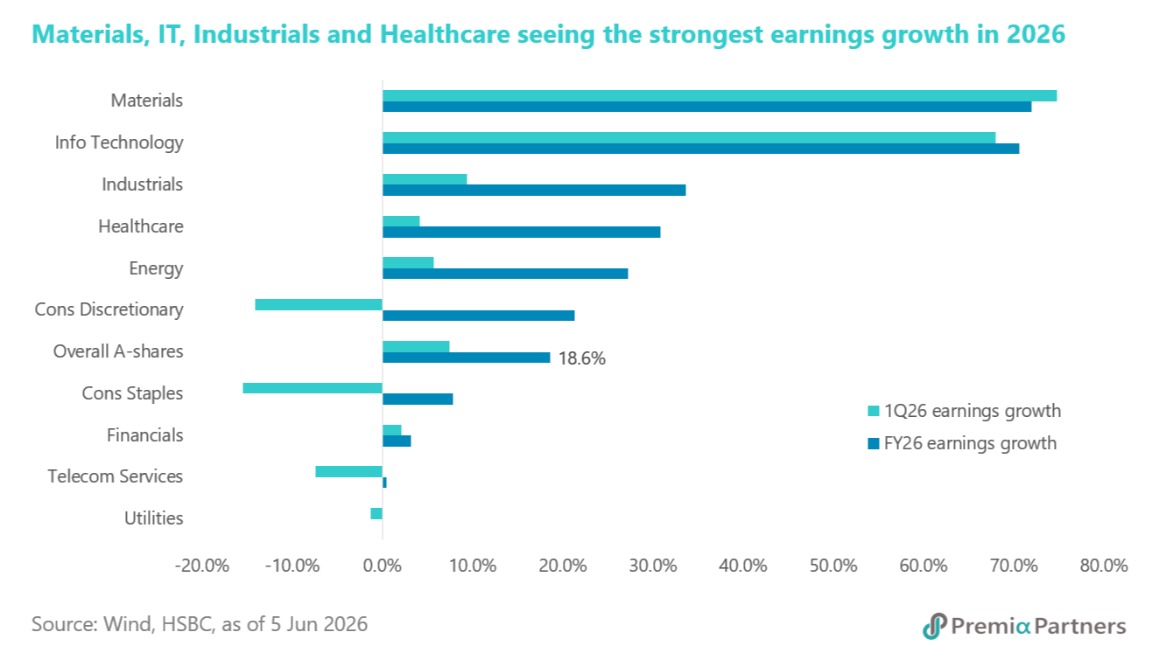
China A-share market has become increasingly polarized, as earnings momentum and growth expectations drove investor flows. While the Information Technology sector has surged 31.9% year-to-date, Consumer Staples have declined 13.8%, illustrating a clear market preference for growth-oriented industries over traditional defensives. The strength of the technology sector is often attributed to the global enthusiasm surrounding artificial intelligence and semiconductor demand, alongside Beijing’s continued support for domestic innovation and import substitution in critical technologies. However, the rally is far from being purely sentiment driven. Corporate fundamentals have provided substantial support. In the first quarter of 2026, Information Technology companies delivered earnings growth of 68.0% year-on-year, second only to Materials at 74.8%. In contrast, Consumer Staples reported a 15.4% earnings decline, reflecting weaker operating momentum. The earnings divergence has also been reinforced by analyst revisions, with full-year profit estimates for Information Technology revised upward by 7.4%, while Consumer Staples experienced a sharp 19.3% downgrade. Looking ahead, earnings growth is expected to remain concentrated in a handful of high-growth sectors. Consensus forecasts point to full-year 2026 earnings growth of 72.0% for Materials, 70.6% for Information Technology, 33.7% for Industrials, and 30.8% for Healthcare, while Utilities, Financials and Consumer Staples are expected to lag. For investors seeking exposure to China’s structural growth themes, the Premia China STAR50 ETF and Premia China New Economy ETF offer targeted access to innovative and high-growth segments of the market, both of which have outperformed the broader A-share market year-to-date.
Jun 15, 2026