
精选观点 & Webinar

As we approach the end of 1H19, it is clear that the market now finds itself in a tug of war between the Fed Put and the potential for recession. We explore this dynamic, discuss Q1 vs future growth across the 4 major economies (US, Europe, Japan and China) and remind investors to stay defensive going forward by tilting toward value and quality where possible.
Jun 12, 2019
The Global Mobile Communication Systems Association estimates that by the end of this year, 5G services will be available in 29 markets around the world, with 10 million connections. What is 5G and where do we see potential investment opportunities from this significant technology upgrade in Asia?
Jun 06, 2019
As the issuer of world’s first two fundamental multifactor China A-shares ETFs, we look closely into the factors. The China A shares market went on a roller coaster ride since late 2018, and how about the factors – are they on the same ride or rotating around a Ferris wheel? In this piece, we re-cap the research on China A fundamental factors and share the recent observations on factor performances.
Jun 03, 2019
Investors looking for China’s NASDAQ seem to have settled on ChiNext as the default index to follow. BUT what if there is an even better option in the market, offering a more appropriate China new economy exposure with better performance, higher quality, lower volatility and discounted valuations?! It may sound too good to be true, but it is exactly what the Premia China New Economy ETF (3173.HK) has achieved so far.
May 20, 2019
Most investors assume that the more liquid the ETF, the easier and cheaper it is to trade. This is true in markets like the US, where on-screen liquidity is prevalent, but Asia markets are not as straightforward. China A ETFs with on-screen liquidity are easy to trade, but easier does not always mean cheaper to trade. There is market risk in trading on-screen and though it is easier, it can actually be more expensive than trading via the underling liquidity of China A stocks inside the ETF.
May 16, 2019
ASEAN equity markets have underperformed so far this year. Is it the start of a new trend, or simply a blip given the strong reversal in China? Say Boon Lim shares his views on why ASEAN is likely to outperform going forward.
May 06, 2019
Nasdaq has made new highs and investors are understandably excited. Similarly, here in Asia we have seen innovative technology companies outperform YTD but with much less fanfare. David Lai explores the major megatrends in Asia and why you need to invest in tech leaders across this region.
May 03, 2019
Looking past stellar Q1 returns, we discuss positioning going forward and the need to navigate the conflicting signals offered by equity and bond markets today
Apr 10, 2019
With the CSI300 up ~25% YTD, many clients are worried that the market has fully priced in the MSCI inclusion. We review 5 flawed assumptions and explain why the rally is just the start of a long-term trend.
Mar 26, 2019
As China markets reacted to expansionary policy news, familiar criticism of China’s debt and leverage concerns has begun to emerge from global investors. Separating myths from reality, our advisor Say Boon Lim shares his thoughts on the 5 biggest myths about China’s economy.
Mar 13, 2019
Premia 图说

赖子健 , CFA
CFA
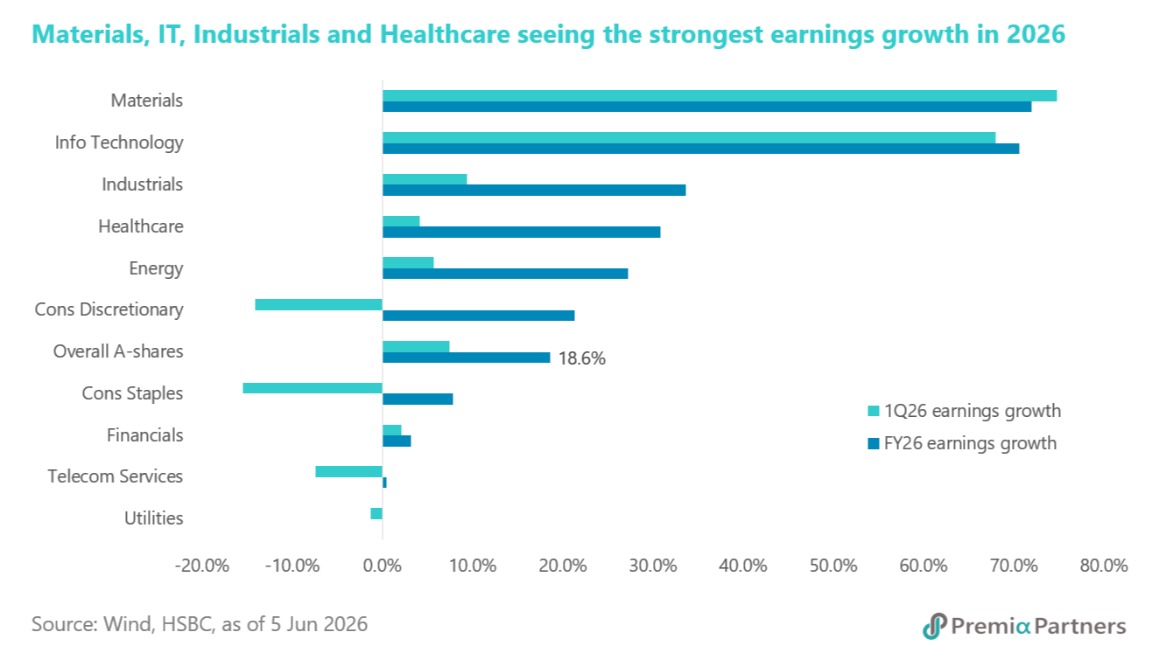
China A-share market has become increasingly polarized, as earnings momentum and growth expectations drove investor flows. While the Information Technology sector has surged 31.9% year-to-date, Consumer Staples have declined 13.8%, illustrating a clear market preference for growth-oriented industries over traditional defensives. The strength of the technology sector is often attributed to the global enthusiasm surrounding artificial intelligence and semiconductor demand, alongside Beijing’s continued support for domestic innovation and import substitution in critical technologies. However, the rally is far from being purely sentiment driven. Corporate fundamentals have provided substantial support. In the first quarter of 2026, Information Technology companies delivered earnings growth of 68.0% year-on-year, second only to Materials at 74.8%. In contrast, Consumer Staples reported a 15.4% earnings decline, reflecting weaker operating momentum. The earnings divergence has also been reinforced by analyst revisions, with full-year profit estimates for Information Technology revised upward by 7.4%, while Consumer Staples experienced a sharp 19.3% downgrade. Looking ahead, earnings growth is expected to remain concentrated in a handful of high-growth sectors. Consensus forecasts point to full-year 2026 earnings growth of 72.0% for Materials, 70.6% for Information Technology, 33.7% for Industrials, and 30.8% for Healthcare, while Utilities, Financials and Consumer Staples are expected to lag. For investors seeking exposure to China’s structural growth themes, the Premia China STAR50 ETF and Premia China New Economy ETF offer targeted access to innovative and high-growth segments of the market, both of which have outperformed the broader A-share market year-to-date.
Jun 15, 2026