
精選觀點 & Webinar

So far in 2019, markets have moved positively and our worst fears from Q4 remain unfounded. However, investors should not be complacent and interpret this period of good news as predictive of the rest of 2019. Markets are likely to again fear the future. In this week’s post, our advisor Say Boon Lim shares his thoughts about the current period of benign market activity.
Feb 18, 2019
As we pass the 6-month anniversary of our latest ETFs, we review their performance since launch, the underlying story behind the exposures and the potential for returns going forward.
Feb 13, 2019
今年,我們正在進入市場的一個交叉路口,許多週期即將告一段落。本文是林哲文先生作為我司資深指導顧問的首篇撰文。林先生在下文中提出了他在當下錯綜複雜的經濟、市場和貨幣週期中對於資產配置的見解。以此配置建議為指引,我們在股票、固定收益、大宗商品和貨幣方面分享了投資者在 2019年可以採用ETF為實踐工具的投資策略。
Jan 25, 2019
Emerging markets seem to be one of the top picks among both sell-side strategies and well-known investors in 2019. We would like to examine if their views are valid and understand better about the reasons behind. To make it into an actionable advice, we also share our thought why emerging ASEAN maybe the crème de la crème and update our readers on the performance of Premia Dow Jones Emerging ASEAN Titans 100 ETF.
Jan 14, 2019
As we wrap up 2018, it’s hard not to reflect on a -25% year in A-shares. As investors, however, we have to look forward and ask ourselves – what’s in store for 2019? Will the trade war result in continued downward momentum? Or will policy accommodation and an improved trade environment result in a massive upside reversal? Looking back 10 years to the global financial crisis, we examine a potential path forward for A-shares in 2019.
Dec 17, 2018
Below is a quick summary of what you need to know regarding this weekend’s G20 Xi-Trump meeting and our thoughts on impact for Asian and Chinese equities.
Dec 03, 2018
For the past 5 years, the surest trade in finance was to bet on US technology stocks and watch market caps double and portfolio returns roll in. However, the last few months have shaken that confidence and now many investors are asking what’s next, given the diminishing growth picture globally. Asian companies focused on innovation offer an interesting opportunity in this regard, especially considering the correction so far and their potential going forward. Though many VC and tech investors have already made the shift to Asia, that move is yet to occur in public equity markets. We believe our Premia Factset Asia Innovative Technology Index, and its corresponding ETF, 3173 HK, should be in every global and tech investors toolkit.
Nov 27, 2018
On the 1 year anniversary of our China A smart beta ETFs, we thought it prudent to reflect on how 2803 HK and 3173 HK have done since launch, as well as take stock of China A-shares markets overall. In this note, we’ll recap the ETF performance and tracking, review China A-shares over the last 12 months, explore which factors worked and didn’t and offer a few thoughts about our expectations going forward. Thanks as always for reading and trusting us with your investments.
Nov 08, 2018
您的科技主題ETF仍然持有谷歌和臉書嗎?您是否想知道全球行業分類標準(GICS)、標準普爾及摩根斯坦利在行業分類重新調整後的變動?在接下來的線上研討會中,我們的合夥人賴子建先生及麥睿康先生將為您闡述此主題,包含行業重新分類對科技主題ETF及亞洲的影響,以及Premia Partners挑選新經濟和創新科技成分股的策略如何快人一步,而且早已超越GICS對全球行業分類的定義。
Oct 22, 2018
當全球投資者泛泛地將整體新興市場視為單壹的風險,新興東盟早已悄悄地從全球新興市場中脫穎而出,並且自今年七月的谷底反彈回升。之所以說”悄悄地”是因為幾乎沒有人談論它,大多數的財經媒體更關註中美貿易戰、土耳其貨幣劇貶、阿根廷經濟危機或其他存在潛在風險的議題。東盟很少成為媒體的寵兒,或許是因為東盟的故事無關乎動蕩或危機,而是持續性的成長和投資機會。
Sep 27, 2018
Premia 圖說

賴子健 , CFA
CFA
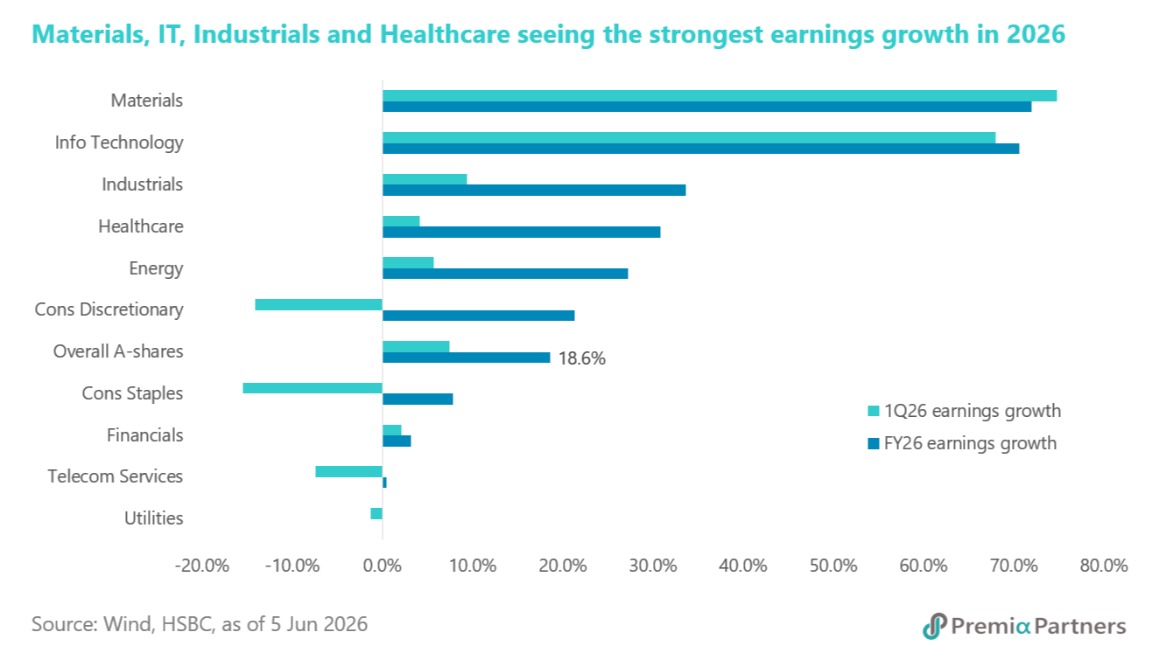
China A-share market has become increasingly polarized, as earnings momentum and growth expectations drove investor flows. While the Information Technology sector has surged 31.9% year-to-date, Consumer Staples have declined 13.8%, illustrating a clear market preference for growth-oriented industries over traditional defensives. The strength of the technology sector is often attributed to the global enthusiasm surrounding artificial intelligence and semiconductor demand, alongside Beijing’s continued support for domestic innovation and import substitution in critical technologies. However, the rally is far from being purely sentiment driven. Corporate fundamentals have provided substantial support. In the first quarter of 2026, Information Technology companies delivered earnings growth of 68.0% year-on-year, second only to Materials at 74.8%. In contrast, Consumer Staples reported a 15.4% earnings decline, reflecting weaker operating momentum. The earnings divergence has also been reinforced by analyst revisions, with full-year profit estimates for Information Technology revised upward by 7.4%, while Consumer Staples experienced a sharp 19.3% downgrade. Looking ahead, earnings growth is expected to remain concentrated in a handful of high-growth sectors. Consensus forecasts point to full-year 2026 earnings growth of 72.0% for Materials, 70.6% for Information Technology, 33.7% for Industrials, and 30.8% for Healthcare, while Utilities, Financials and Consumer Staples are expected to lag. For investors seeking exposure to China’s structural growth themes, the Premia China STAR50 ETF and Premia China New Economy ETF offer targeted access to innovative and high-growth segments of the market, both of which have outperformed the broader A-share market year-to-date.
Jun 15, 2026